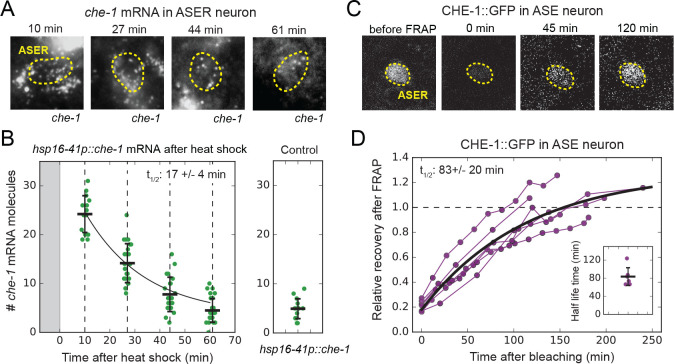
Figure 3. che-1 mRNA and protein lifetimes.
(A) che-1 mRNAs in L2 larvae at different times after induction of che-1 by a 37 °C heat shock in hsp16-41p::che-1 animals, visualized by smFISH. Dashed lines outline ASER neuron. (B) che-1 mRNA level in ASE neurons of individual L2 animals (green) as function of time after a 10 min heat shock (gray area). Black line is the fitted decay curve. Control L2 larvae did not receive a heat shock. The measured che-1 mRNA half-life was 17 ± 4 mins. (C) CHE-1::GFP fluorescence recovery after photobleaching (FRAP) in the ASER neuron of a single L4 animal. Time is indicated relative to bleaching of CHE-1::GFP. (D) Fluorescence recovery of CHE-1::GFP in ASE neurons of L4 or young adult animals (n = 6). An exponential recovery curve model was fitted to data of each individual animal (black line indicates the average recovery curve). The inset shows the fitted half-life for each individual animal. The average measured CHE-1::GFP protein half-life was 83 ± 20 min. Error bars in B represent mean ± SD. n ≥ 10 in B and n = 6 in D.

