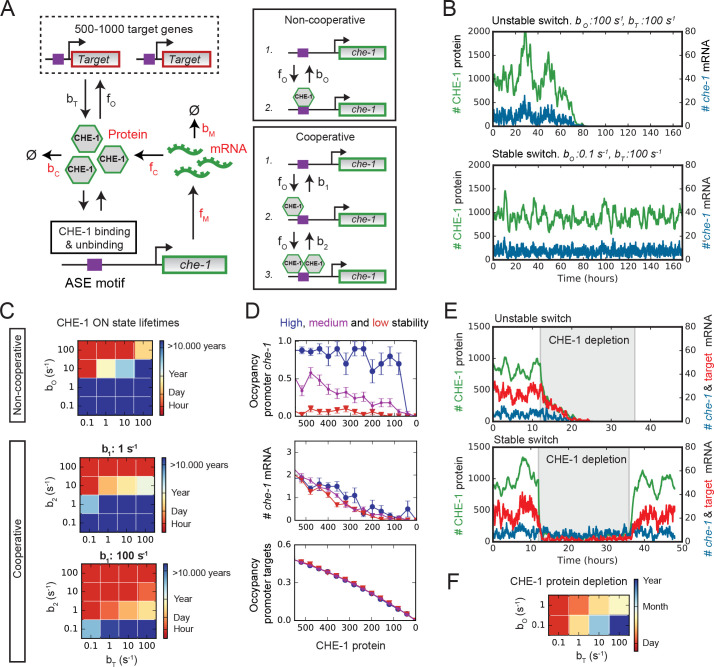
Figure 4. Stable ON state by preferential binding of CHE-1 to its own promoter.
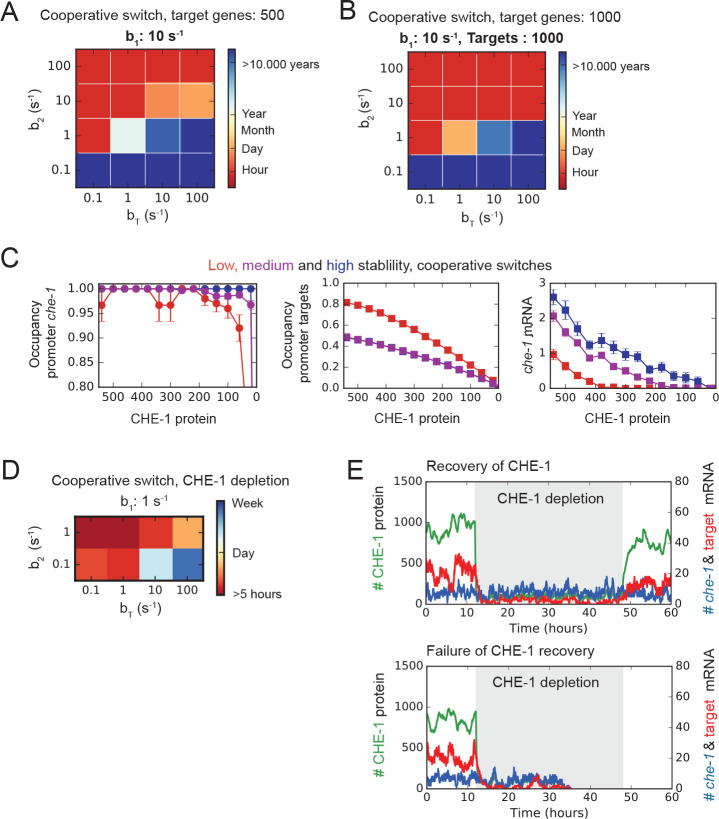
(A) Overview of the bistable, stochastic CHE-1 switch model, including production and degradation of che-1 mRNA and protein, and binding of CHE-1 protein to its own promoter and other target genes. Parameters constrained by experiments are red. Inset: CHE-1 binding is modelled as monomers (non-cooperative) or dimers (cooperative). (B) Stochastic simulations of the non-cooperative model for parameters with an unstable (top) or stable (bottom) ON state (che-1 expression), showing levels of che-1 mRNA (blue) and protein (green). For parameters resulting in an unstable switch, stochastic fluctuations induce a spontaneous transition to the OFF state (no che-1 expression). (C) Average ON state lifetimes calculated using Forward Flux Sampling (FFS) as function of CHE-1 dissociation rates from its own promoter ( or ) and its target genes () for the non-cooperative and cooperative model. Stable ON state occurs for high che-1 promoter occupancy by CHE-1 ( <1 or <1) and preferential affinity of CHE-1 for its own promoter compared to that of its target genes ( or ). (D) Average CHE-1 occupancy of the promoter of che-1 (top) and other target genes (bottom), and average che-1 mRNA level (middle) during spontaneous transitions from the ON to the OFF state, as sampled by FFS. Shown are transition paths for parameters with low (red, ), medium (magenta, ), and high (blue, ) stability of the ON state, with . For simulations with a stable ON state, the che-1 promoter remained fully occupied by CHE-1, even as CHE-1 protein levels approached zero, in contrast to the occupancy of promoters of other CHE-1 target genes. (E) Simulations showing the impact of transient depletion of CHE-1 protein (green) on mRNA levels of che-1 (blue) and a target gene (red). CHE-1 is depleted to 100 molecules/cell by a transient increase in degradation ( ; grey region). For parameters with an unstable ON state (top), both che-1 and target gene mRNA levels fall rapidly, and do not recover when CHE-1 depletion ceases. For a stable ON state (bottom), expression of che-1 is unaffected by CHE-1 depletion, leading to full recovery once CHE-1 depletion ends. (F) Average ON state lifetimes, calculated by FFS, during CHE-1 depletion to 100 molecules/cell. Parameter combinations with a stable ON state under normal conditions maintain che-1 expression for hours or days under induced CHE-1 depletion.


