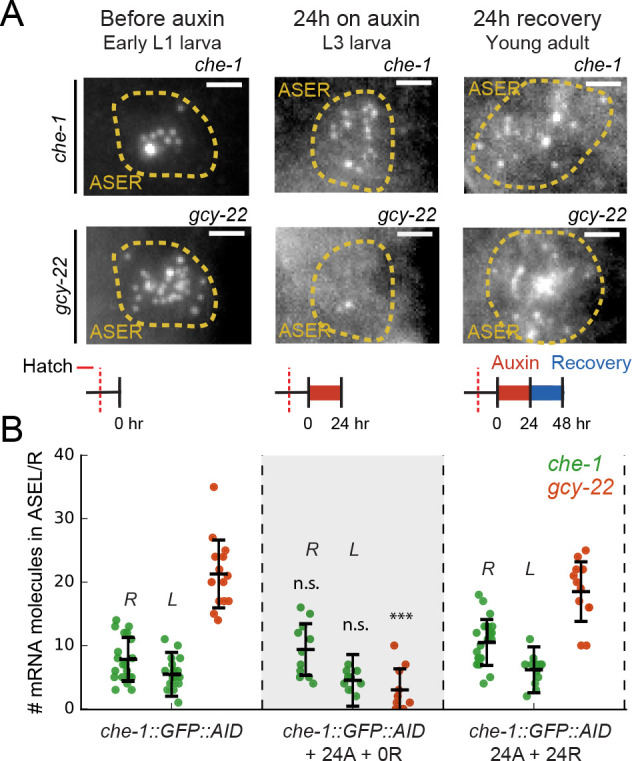
Figure 5. Maintenance of che-1 expression during transient CHE-1 depletion.

(A) che-1 and gcy-22 mRNA levels in ASER neurons, visualized by smFISH in che-1::GFP::AID animals, at different moments in a 24 hr auxin and 24 hr recovery treatment. Schematics indicate the time and duration of auxin treatment and recovery. Scale bar: 2 μm. (B) che-1::GFP::AID (green, ASEL/R) and gcy-22 (red, ASER) mRNA levels quantified in che-1::GFP::AID animals at different times in a 24 hr auxin and 24 hr recovery treatment. Upon depletion of CHE-1::GFP::AID protein, che-1 expression was not impacted, while gcy-22 levels strongly decreased. gcy-22 expression rose to wild-type levels after 24 hr recovery off auxin. Error bars in B represent mean ± SD. n ≥ 10. ***p < 0.001.
