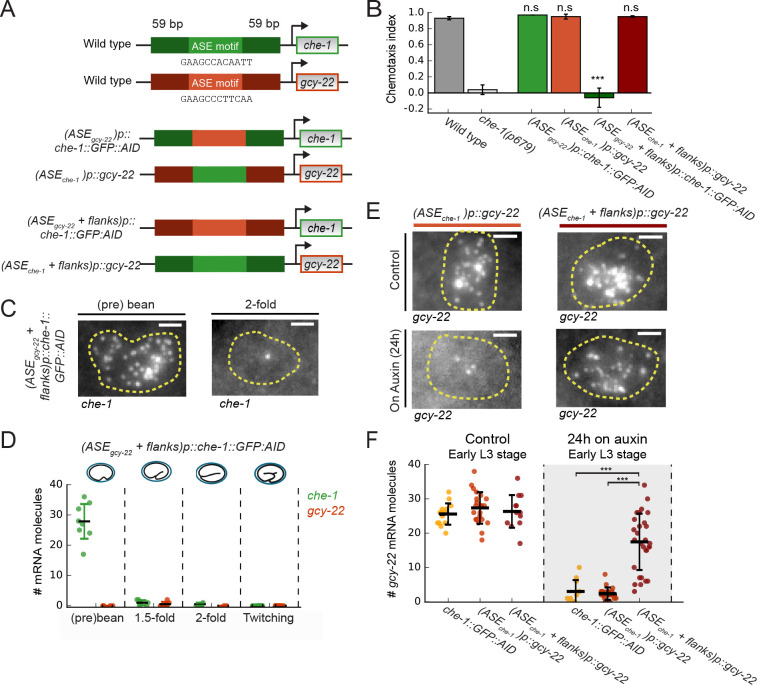
Figure 6. Region flanking CHE-1-binding site ensures resilience to CHE-1 depletion.
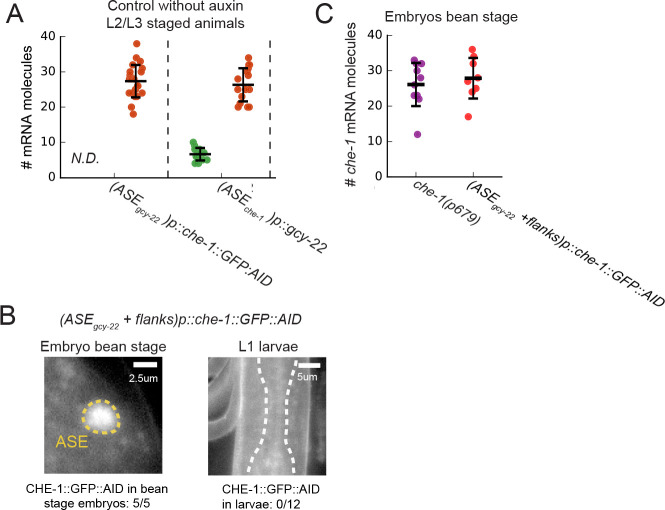
(A) Overview of che-1 promoter mutants generated in the che-1::GFP:AID background. We exchanged either the che-1 (green) or gcy-22 (red) ASE motif, which binds CHE-1, or a larger region that includes 59 bp flanks on either side. (B) Average chemotaxis index for response to 10 mM NaCl, of wild-type and che-1(p679) animals, and che-1 promoter mutants. Exchange of ASE motifs between che-1 and gcy-22 promoters did not affect chemotaxis. Replacing the che-1 ASE motif with flanks for that of gcy-22 abolished chemotaxis to NaCl; the reverse had no effect. (C) che-1 expression visualized by smFISH in ASE neurons of (ASEgcy-22+ flanks)p::che-1::GFP::AID embryos. In twofold embryos, che-1::GFP::AID mRNA levels were low. Scale bar: 1.5 μm. (D) che-1::GFP::AID and gcy-22 mRNA levels quantified in the ASE neurons of (ASEgcy-22+ flanks)p::che-1::GFP::AID embryos. After initial high che-1::GFP::AID expression at the time of ASE specification, che-1::GFP::AID and gcy-22 expression was almost absent, indicating a failure of ASE fate maintenance. (E) gcy-22 expression under normal conditions or upon CHE-1::GFP::AID depletion by auxin, in L3 larvae of che-1 promoter mutants. Scale bar: 1.5 μm. (F) Quantification of gcy-22 mRNA levels upon auxin-induced CHE-1::GFP::AID depletion, in gcy-22 promoter mutants. In (ASEgcy-22)p::che-1::GFP::AID animals, gcy-22 mRNA levels fell on auxin, as observed before. However, in (ASEche-1+ flanks)p::gcy-22 animals treated with auxin gcy-22 levels remained high. Thus, the region flanking the che-1 ASE motif drives the maintenance of che-1 expression during CHE-1 protein depletion. Error bars in B represent mean ± S.E.M, D and F represent mean ± SD. n ≥ 10. ***p < 0.001.


