. 2021 Dec 15;10:e66955. doi: 10.7554/eLife.66955

Figure 7. An Otx-related homeodomain transcription factor binding site involved in long-term maintenance of ASE cell fate.

(A) Position of an Otx-related homeodomain transcription factor (HD-TF) binding site in the che-1 promoter. Green lines indicate the positions of the 59 bp flanks surrounding the ASE motif. HD-TF binding site depicted as a sequence logo. In (ΔHD)p::che-1::GFP::AID animals, the HD-TF-binding site is deleted in the che-1::GFP::AID background. (B) Average chemotaxis index for response to 10 mM NaCl, of wild-type, che-1::GFP::AID and che-1(p679) animals, and (ΔHD)p::che-1::GFP::AID mutant. Deleting the HD-TF-binding site caused a decreased response to NaCl. (C) Fraction of (ΔHD)p::che-1::GFP::AID animals expressing CHE-1::GFP::AID in ASER (dark gray) and ASEL (light gray) at different developmental stages. CHE-1::GFP::AID is progressively lost during development. (D) che-1::GFP::AID and gcy-22 mRNA levels in (ΔHD)p::che-1::GFP::AID animals quantified by smFISH. Expression was similar to wild-type until late-stage, twitching embryos, but fell rapidly in newly-hatched L1 larvae. Scale bar: 2 μm. (E) CHE-1::GFP expression dynamics in single che-1::GFP (grey) and (ΔHD)p::che-1::GFP::AID (green) animals during larval development. Approximate timing of molts is indicated M1-M4. CHE-1::GFP::AID expression in (ΔHD)p::che-1::GFP::AID animals was lost in a rapid and stochastic manner, at different times during development. Error bars represent S.E.M (B,D) or S.D. (C). n ≥ 10. **p < 0.01, ***p < 0.001.

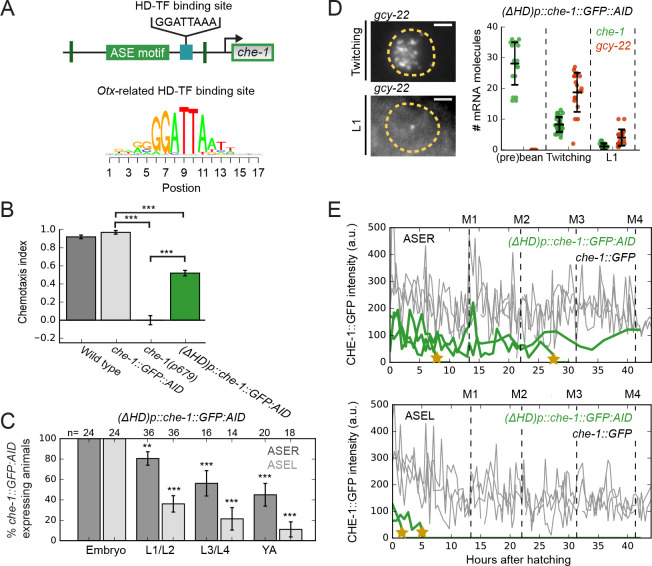
Figure 7—source data 1. Data and scripts for Figure 7 and related figure supplements.

Figure 7.

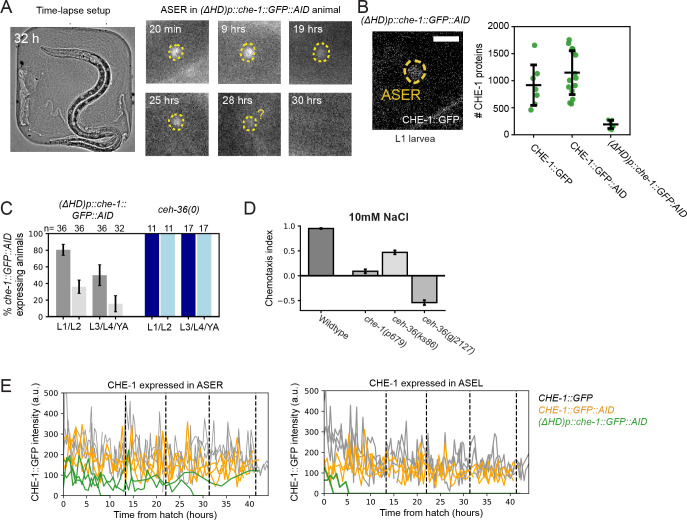
Figure 7—figure supplement 1. Role of HD-TF-binding site in maintaining CHE-1::GFP expression.

Figure 7—figure supplement 1.

(A) Long-term time-lapse microscopy of a single (ΔHD)p::che-1::GFP::AID animal, using microchambers to constrain larvae to the field of view (left). CHE-1::GFP::AID signal in ASER disappeared rapidly in the L3 larval stage, 30 hr after hatching (right). (B) Image of CHE-1::GFP::AID in (ΔHD)p::che-1::GFP::AID L1 larva (left). Comparison of protein copy number in che-1::GFP, che-1::GFP::AID, and (ΔHD)p::che-1::GFP::AID animals (right). While for che-1::GFP and che-1::GFP::AID data was collected in L4-YA animals, data for (ΔHD)p::che-1::GFP::AID was collected in L1-L2 larvae, as older animals often failed to show CHE-1::GFP::AID signal. (C) Fraction of (ΔHD)p::che-1::GFP::AID animals expressing CHE-1::GFP::AID in ASER (dark gray) and ASEL (light gray) versus fraction of ceh-36(gj2127) deletion mutant animals expressing CHE-1::GFP::AID in ASER (dark blue) and ASEL (light blue). (D) Chemotaxis index for response to 10 mM NaCl, of wild-type, che-1(p679), ceh-36(ks86) and ceh-36(gj2127) animals. (E) Expression dynamics in single che-1::GFP (gray), che-1::GFP::AID (orange) and (ΔHD)p::che-1::GFP::AID (green) animals during larval development.
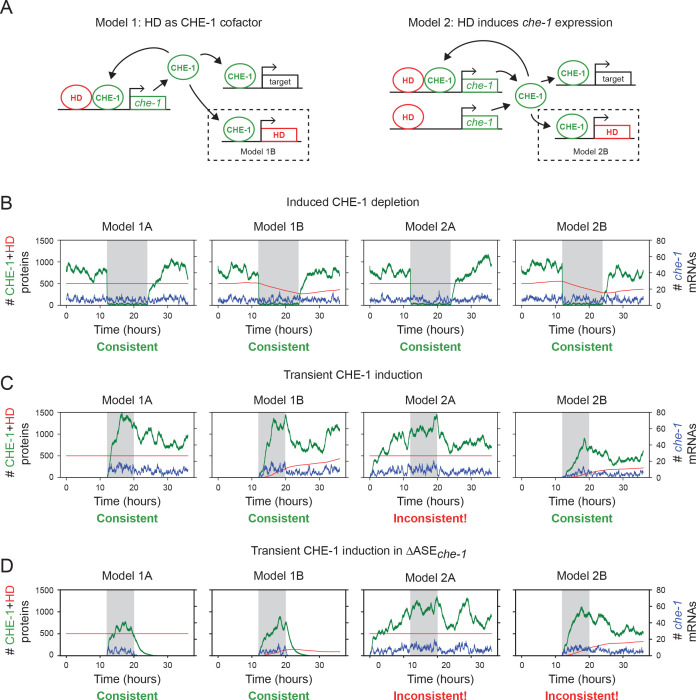
Figure 7—figure supplement 2. Models of HD-TF action.

Figure 7—figure supplement 2.

(A) Two qualitatively different models for Homeodomain transcription factor (HD-TF) action. Model 1: HD-TF acts as a co-factor that only impacts the affinity of CHE-1 for the che-1 promoter. Specifically, interaction between HD-TF and CHE-1 is cooperative, with the unbinding rate of both HD-TF and CHE-1 lowered from 100 s–1 to 0.1 s–1 when both are bound together. Transcription of che-1 is only initiated when CHE-1 is bound. Model 2: HD-TF induces che-1 expression independent of CHE-1. Both HD-TF and CHE-1 bind independently, with unbinding rate of 100 s–1, and che-1 transcription is initiated when CHE-1 and/or HD-TF is bound. For both models, we compared two variants: one where HD-TF expression is constitutive (Models 1 A, 2 A) and one where HD-TF expression is controlled by CHE-1 binding (Models 1B, 2B). All four models exhibit bistability in their mass action rate equations. For full parameters, see Materials and methods. (B) Time dynamics of CHE-1 (green) and HD-TF protein level (red), and che-1 mRNA (blue). All models can reproduce the observed resilience of che-1 expression under induced CHE-1 depletion (gray interval). For models 1B and 2B, where HD-TF is a target of CHE-1, this required that the half-life of HD-TF is long compared to the interval of induced CHE-1 depletion. (C) Models 1 A, 1B, and 2B reproduce the persistent che-1 expression induced by a transient inductive signal. Transient CHE-1 induction was modelled by basal che-1 expression, that is independent of CHE-1 level, at rate fM,0 during the interval indicated in grey. For Model 2 A, constitutive expression of HD-TF induced che-1 expression already prior to the presence of the inductive signal. (D) Models 1 A and 1B reproduced the failure to maintain che-1 expression following a transient external inductive signal (gray interval) in mutants of the ASE motif of the che-1 promoter, as was observed experimentally (Leyva-Díaz and Hobert, 2019). In these experiments, mutations of the ASE motif were predicted to abolish binding of CHE-1 to its own promoter and were therefore modelled by setting the CHE-1 binding rate for its own promoter to zero. For Models 2 A and 2B, transient induction of CHE-1 led to expression of HD-TF, which subsequently maintained expression of both HD-TF and CHE-1, contrary to the experimental observations.