. 2021 Nov 23;10:e73724. doi: 10.7554/eLife.73724

Figure 1. Structure and active site of the aged actomyosin-V complex bound to ADP.

(A) Atomic model and LAFTER density map of the central myosin-V-LC subunit (orange, LC: white) bound to aged F-actin-PHD (shades of sea green, three subunits shown, A-1 to A+1). Nucleotides and PHD are highlighted in orange, pink, and yellow, respectively. The HF helix is marked by a black arrowhead. (B) Close-up view of the myosin active site consisting of the P-loop (yellow, 164–168), switch I (blue, aa 208–220), switch II (green, aa 439–448), and the A-loop (purple, aa 111–116). Only side chains involved in the binding of ADP are displayed, also see Figure 1—figure supplement 3. (C) 2D protein-ligand interaction diagram illustrating the coordination of Mg2+-ADP by hydrogen bonds (dashed green lines) and hydrophobic interactions (red rays). (D) Illustration of the model-map agreement within a central section of myosin. Most side chains are resolved by the post-refined density map (transparent gray). See Figure 1—video 1 for a three-dimensional visualization and Figure 1—figure supplements 12 for an overview of the processing pipeline and the cryo-EM data, respectively. A comparison of the strong-ADP state of different myosins can be found in Figure 1—figure supplements 4 and 5. Figure 1—figure supplement 6 illustrates the domain architecture of myosin.

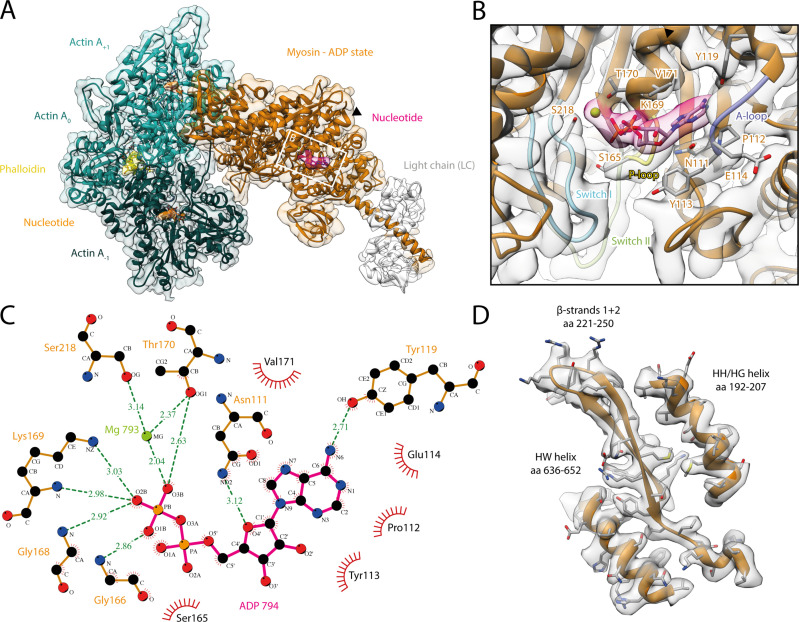
Figure 1.

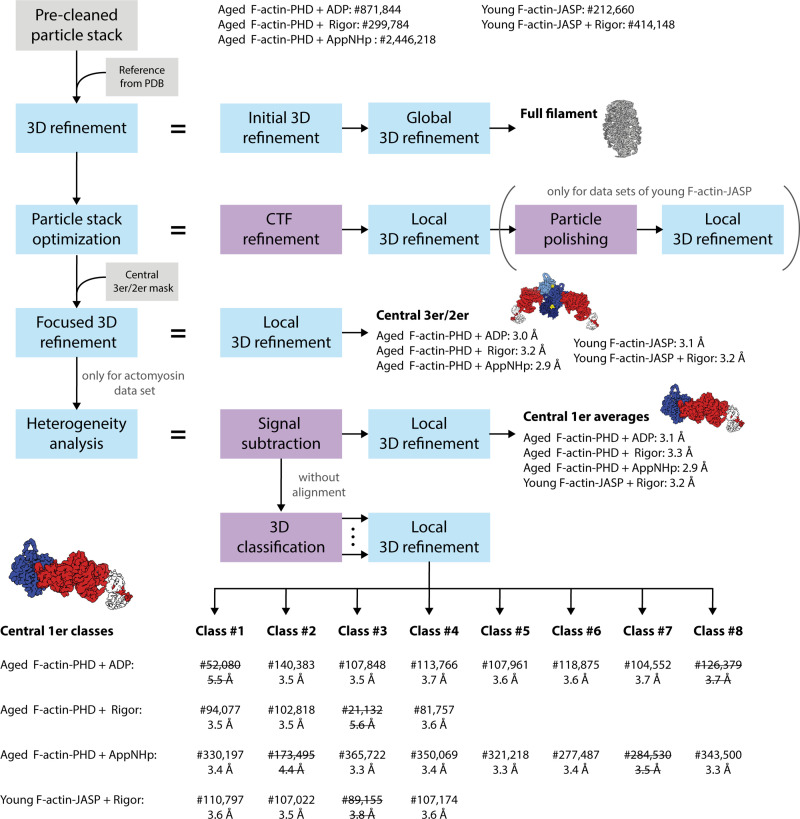
Figure 1—figure supplement 1. Schematic of the cryo-EM processing pipeline.

Figure 1—figure supplement 1.

Auto-picked particle stacks were initially pre-cleaned by 2D classification (final number of particles stated). Cleaned stacks were 3D refined against an initial reference generated from an atomic model of actomyosin (PDB: 5JLH; von der Ecken et al., 2016) without applying a 3D mask. The resulting 3D density map was used as reference volume in a subsequent masked 3D refinement yielding a first high-resolution structure of the full actomyosin filament. Based on this, particle stacks were optimized by CTF refinement and in case of the young F-actin-JASP data sets by additional particle polishing, followed by a local 3D refinement. By applying a mask including only the central three actin and two myosin molecules (central 3er/2er), the refinement was subsequently focused on the central section of the filament (central 3er/2er maps, resolutions stated). To account for the structural heterogeneity observed in the actomyosin data sets, a heterogeneity analysis was performed. Here, particles were initially signal subtracted to remove everything but the central actomyosin subunit (central 1er). These particles were then locally 3D refined to produce average structures (central 1er maps, resolutions stated). In addition, signal-subtracted particles were 3D classified without alignment to separate distinct conformations. The number of classes was optimized experimentally to yield a maximum number of high-resolution 3D classes. Finally, subsets were locally 3D refined, resulting in 18 high-resolution structures (central 1er classes, final number of particles and resolutions stated). Classes of insufficient quality (struck through) were not modeled and omitted in all subsequent analysis steps.
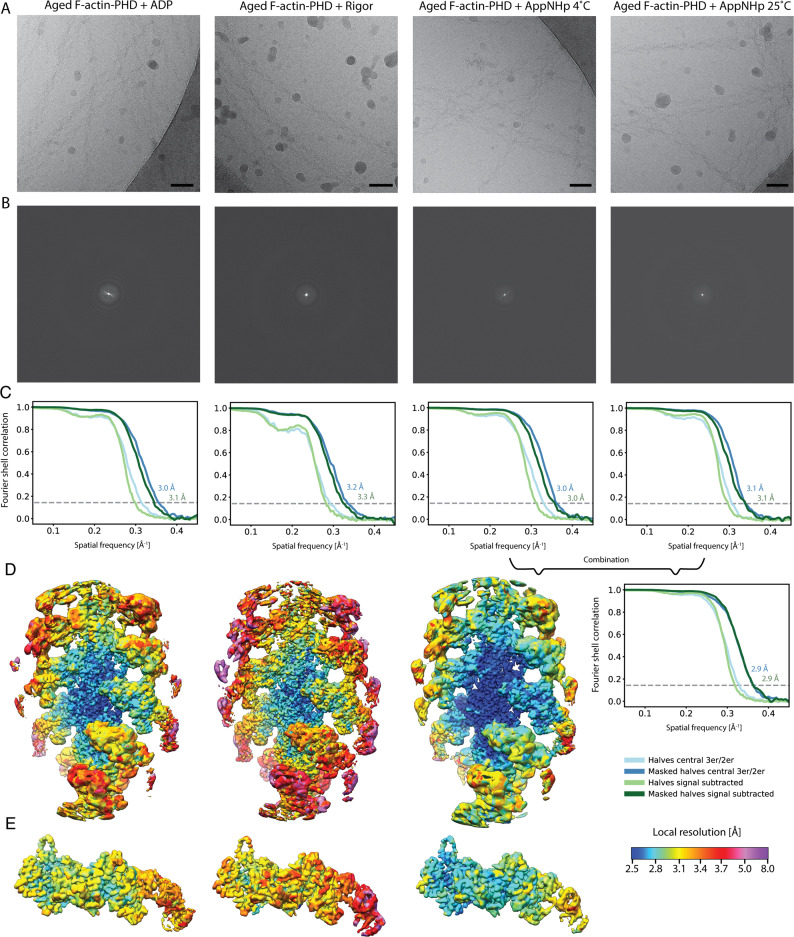
Figure 1—figure supplement 2. Overview of the cryo-EM data and resolution of aged F-actin-PHD in complex with myosin-V in the rigor, ADP, and AppNHp state.

Figure 1—figure supplement 2.

(A) Representative micrographs at –1.3 μm defocus and (B) their power spectra. (C) Fourier shell correlation (FSC) curves for masked (darker shade, with resolution values) and unmasked half maps (lighter shade) including either three actin subunits and two myosin molecules (central 3er/2er, shades of blue, also see Figure 1—figure supplement 1) or one actomyosin subunit (signal subtracted, central 1er, shades of green). (D) Color-coded local resolution of full filaments and (E) signal-subtracted actomyosin subunits for all three states. Note that the two AppNHp data sets (4°C and 25°C) were combined to increase the overall resolution. Scale bar 500 Å.
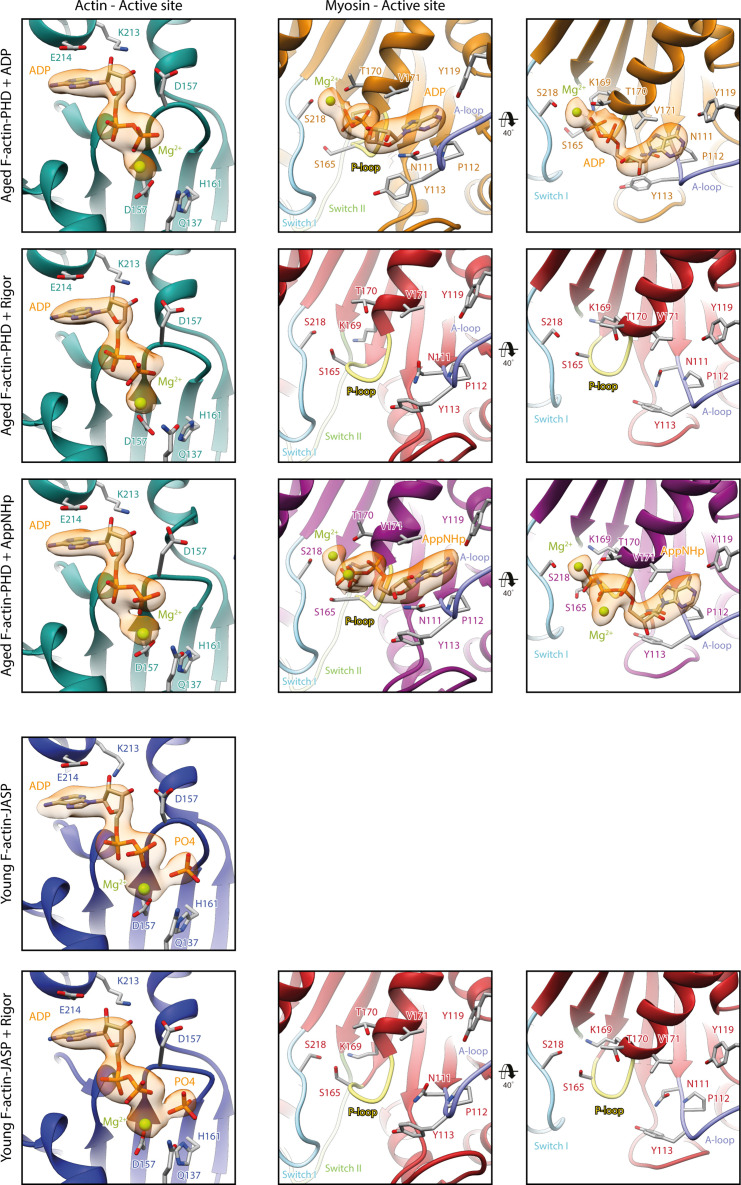
Figure 1—figure supplement 3. Nucleotide densities at and organization of the active sites of actin and myosin.

Figure 1—figure supplement 3.

Close-up views of the active site of F-actin (left column) and myosin-V (middle and right column) of all five structures. Ribbons are color-coded according to the respective structural state; aged F-actin-PHD: sea green; young F-actin-JASP: blue; and myosin-V in the rigor: red; ADP: orange; and AppNHp state: purple. Key loops of the myosin active site are highlighted by pastel colors; P-loop: yellow; switch I: blue; switch II: green; and A-loop: purple. Nucleotide densities are shown in orange and clearly support the presence of Pi in young JASP-stabilized F-actin. While there is density for a Mg2+ ion in all occupied active sites, there is an additional density, likely corresponding to a second Mg2+ ion, in AppNHp-bound myosin.
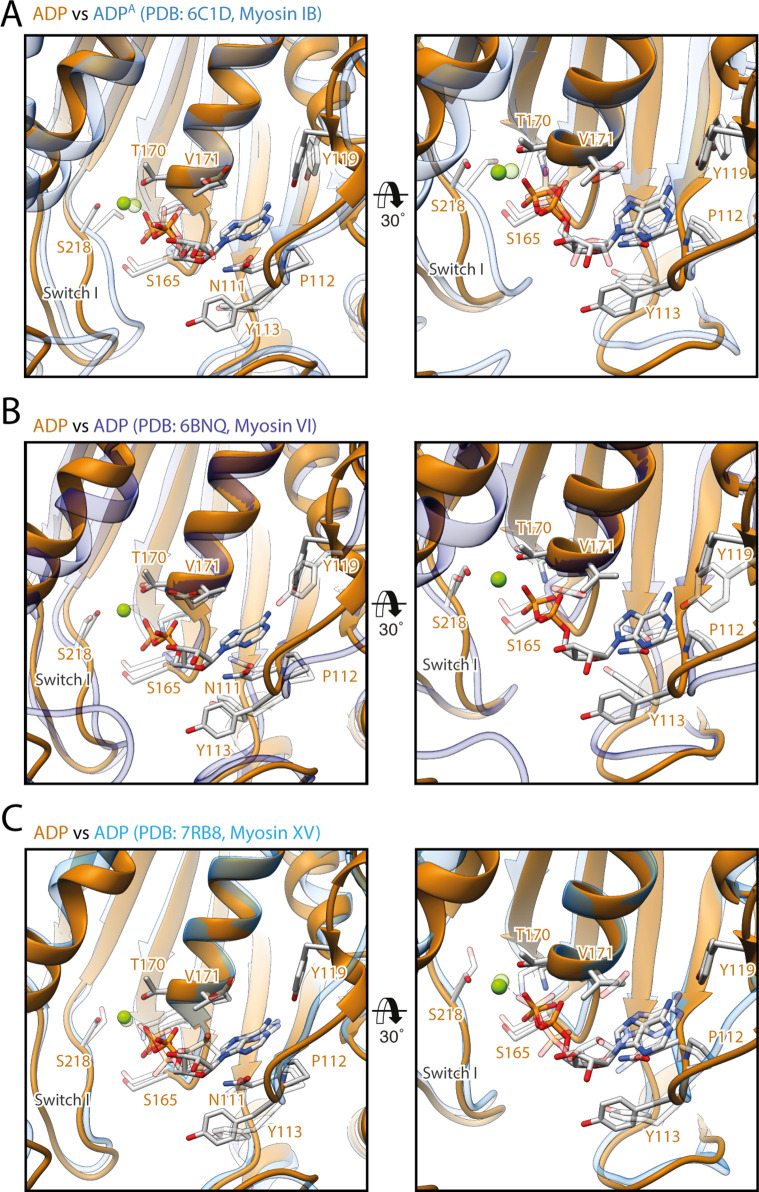
Figure 1—figure supplement 4. Comparison of the coordination of Mg2+-ADP in different myosins.

Figure 1—figure supplement 4.

Comparison of the active sites of myosin-V in the strong-ADP state (orange) with the ones of (A) myosin-IB (PDB: 6C1D; Mentes et al., 2018), (B) myosin-VI (PDB: 6BNQ, nucleotide not modeled; Gurel et al., 2017), and (C) myosin-XV (PDB: 7R91, Gong et al., 2021) in the same state (shades of blue, shown as transparent). The coordination of Mg2+-ADP is almost identical in all four atomic models. Only the relative positions of switch I differ considerably, resulting in shifting of the coordinated Mg2+ ion. Atomic models were aligned on the HF helix (aa 169–181). Residue labels are given for myosin-V only.
Figure 1—figure supplement 5. Structural variations of the rigor and strong-ADP states of different actomyosin complexes.

Figure 1—figure supplement 5.

Comparison of atomic models of the rigor and strong-ADP states of different actomyosin complexes solved by cryo-EM. (A) Superposition of the rigor states of myosin-V (red), myosin-II (PDB: 5H53; Fujii and Namba, 2017), myosin-NMIIC (PDB: 5JLH; von der Ecken et al., 2016), myosin-NMIIC (PDB: 5JLH; von der Ecken et al., 2016), myosin-IB (PDB: 6C1H; Mentes et al., 2018), and myosin-XV (PDB: 7R91; Gong et al., 2021) (shades of gray), illustrating strongly varying conformations and lever arm orientations. (B) Superposition of the strong-ADP states of myosin-V (orange), myosin-IB (PDB: 6C1D; Mentes et al., 2018), and myosin-XV (PDB: 7RB8; Gong et al., 2021) (shades of gray). The corresponding rigor states are shown as transparent. The difference in the orientation of the lever arm, which is caused by variations in the overall conformation, is even more pronounced in the strong-ADP state, increasing from a relative rotation of 54° to 71° for myosin-V and myosin-IB. These variations highlight the need to solve all key states of the motor cycle for a single myosin to reliably describe its structural transitions and ultimately the force generation mechanism. Structures are shown without the light chain after alignment on the actin subunit.
Figure 1—figure supplement 6. Domain architecture of the myosin motor domain.

Figure 1—figure supplement 6.

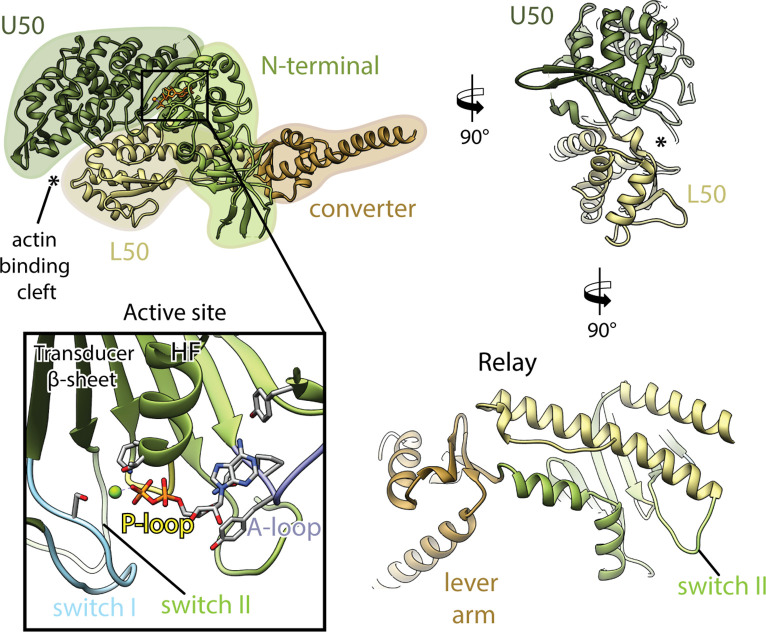
Schematic illustrating the architecture of the myosin motor domain consisting of the actin-binding upper (U50, dark green) and lower 50 kDa domains (L50, tan), as well as the N-terminal domain (light green) and the converter domain (brown), which includes the light chain-binding lever arm. The U50 and L50 kDa domains are separated by a large cleft known as actin-binding cleft (highlighted by an asterisk). The active site resides at the interface of the U50 and N-terminal domain (black box, nucleotide shown in orange). The nucleotide localizes close to the HF helix (aa 169–183) and is coordinated by four loops including the P-loop: pastel yellow (aa 164–168); switch I: pastel blue (aa 208–220); switch II: pastel green (aa 439–448); and the A-loop: pastel purple (aa 111–116). Key structural elements such as the central transducer β-sheet and the relay helix (aa 449–479) are labeled.
Figure 1—video 1. Structure of the aged actomyosin-V complex bound to ADP.
Download video file (14.5MB, mp4)
Three-dimensional visualization of the aged actomyosin-V complex bound to ADP. Overview of the (A) overall structure, (B) active site, and (C) a central section of myosin, as shown in Figure 1A, B and D.