. 2021 Nov 23;10:e73724. doi: 10.7554/eLife.73724

Figure 5. Indistinguishable actomyosin interfaces in the strong-ADP, rigor, and post-rigor transition (PRT) state.

Comparison of the actomyosin-V interface within all three states (rigor: red; strong-ADP: orange; and AppNHp-bound PRT: purple) illustrating the remarkable similarity of interactions with F-actin. (Top) Front and back views of the central myosin molecule and the two actin subunits it is bound to (shades of green and blue, A+1 and A-1; see Figure 1—figure supplement 3 for color code). Black boxes indicate the location of close-up views shown below. (Bottom) Close-up views of all actin-myosin interfaces including the cardiomyopathy (CM) loop, the helix-loop-helix (HLH) motif, loops 2–4, and the activation loop (highlighted by an asterisk). Side chains of key residues are displayed and labeled for all states (rigor: black; ADP and AppNHp: gray). Dashed lines indicate hydrogen bonds predicted for the rigor (black) and ADP/AppNHp state (gray), respectively. See Figure 5—video 1 for a three-dimensional visualization including density maps.

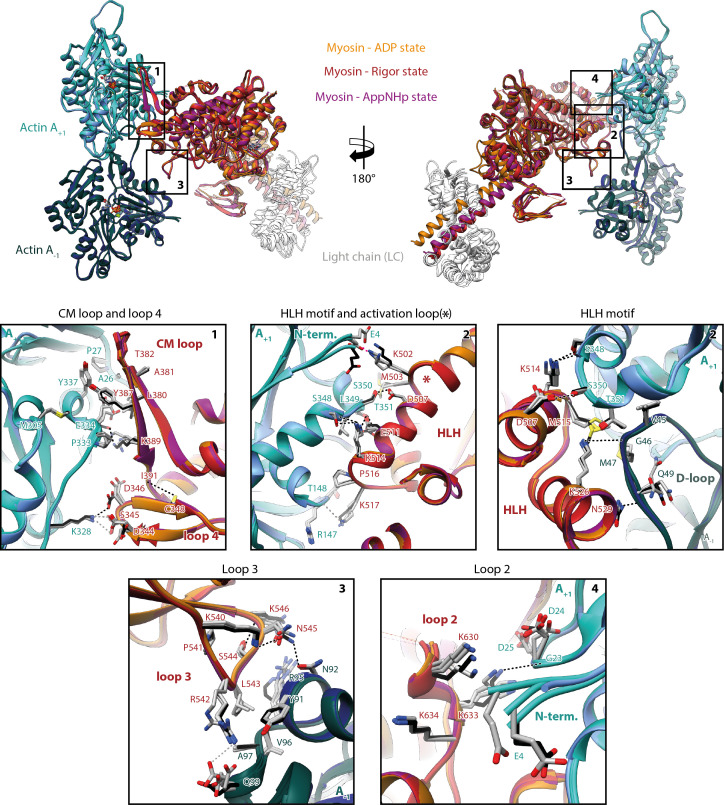
Figure 5.

Figure 5—video 1. Conservation of the actomyosin-V interface.
Download video file (47.8MB, mp4)
Comparison of the actomyosin-V interface within all three states (rigor: red; strong-ADP: orange; and AppNHp-bound post-rigor transition (PRT): purple). (A, J) Overview of the central myosin molecule and the two actin subunits it is bound to (shades of green and blue, A+1 and A-1; for color code, see Figure 1—figure supplement 3). (B–I) Close-up views highlighting the localization and molecular details of all actin-myosin interfaces including the cardiomyopathy (CM) loop and loop 4 (B–D), the helix-loop-helix (HLH) motif and activation loop (highlighted by an asterisk) (D–G), loop 3 (B, D, G, H), and loop 2 (D, G, I). In close-up views of specific interfaces, the structure of the aged actomyosin-V complex in the rigor state is first shown on its own, followed by a superposition of all models illustrating the remarkable similarity of the actomyosin interface. Corresponding density maps are additionally shown as mesh (rigor: red; strong-ADP: orange; PRT: purple; and young rigor: gray). See Figure 5 for residue labels and predicted hydrogen bonds.