. 2021 Nov 23;10:e73724. doi: 10.7554/eLife.73724

Figure 9. Conformational heterogeneity of myosin-V.

Illustration of the conformational heterogeneity of myosin-V in the rigor (red), strong-ADP (orange), and AppNHp-bound post-rigor transition (PRT) state (purple) when bound to F-actin (aged F-actin-PHD: sea green; young F-actin-JASP: blue). (A) Superposition of all atomic models (central 1er, average: opaque; 3D classes: transparent) built for each state. Models were either aligned on the F-actin subunit or the HF helix (indicated by black arrowhead). Pivoting of the U50 domain in combination with shifting and twisting of the central transducer β-sheet results in a rotation of the N-terminal and converter domain, giving rise to a two-dimensional distribution of lever arm orientations. The extent of these changes depends on the nucleotide state and is largest in the strong-ADP and PRT state. Insets show either the transducer β-sheet (black dot) or the active site (asterisk), which basically remains unchanged within all models of one state. (B) Mapping of atomic models (average and 3D classes) into the first two principal components of a principal component analysis (PCA) illustrating the overall conformational space covered. Classes are labeled by their number (#1–#8; also see Figure 1—figure supplement 1). For a comparison of conformational extremes, see Figure 9—figure supplement 1. Morphs of extremes and trajectories along the principal components are visualized in Figure 9—video 1, Figure 9—video 2, and Figure 9—video 3. See Figure 1—figure supplement 6 for an overview of the domain architecture of myosin.

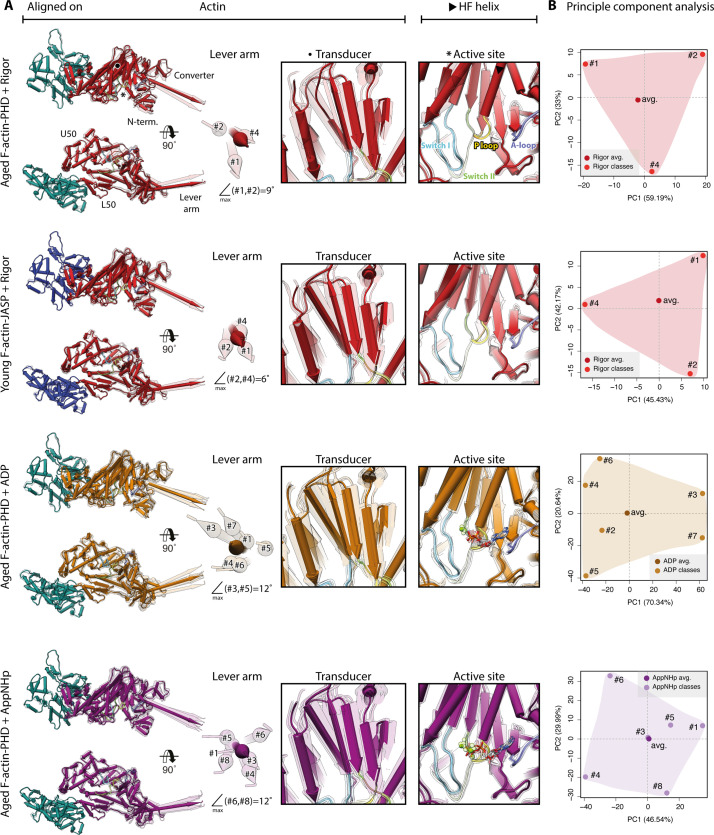
Figure 9.

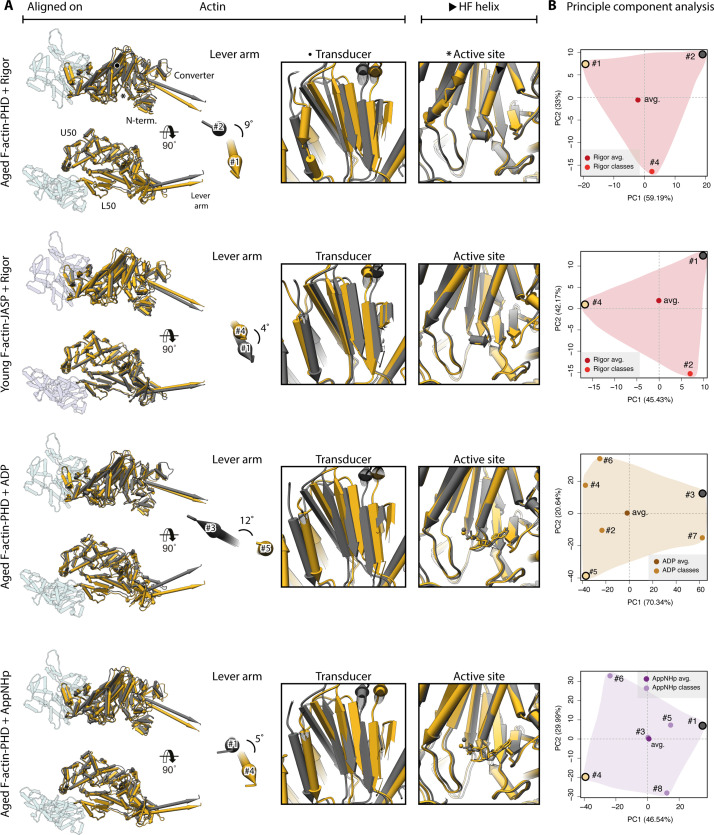
Figure 9—figure supplement 1. Extreme conformations of myosin-V.

Figure 9—figure supplement 1.

Extreme conformations of myosin-V in the rigor, strong-ADP, and AppNHp-bound PRT state. (A) Superposition of atomic models as shown in Figure 9, but displaying only the extreme structures along the first principal component (yellow and gray). (B) Mapping of atomic models (average and 3D classes) into the first two principal components as shown in Figure 9. The localization of the extreme structures shown in (A) is highlighted by a yellow and gray dot, respectively.
Figure 9—video 1. Structural heterogeneity of myosin-V in the strong-ADP state.
Download video file (17.7MB, mp4)
(A, B) Three-dimensional visualization of the average structure of aged actomyosin-V in the strong-ADP state (myosin: orange; F-actin: sea green; PHD: yellow; LC: white). (C) Morph of 3D class average models illustrating the conformational heterogeneity of myosin (classes are ordered by their number; also see Figure 1—figure supplement 1). (D, E) Morph of extreme structures along the first (D) and second (E) principal components; also see Figure 9—figure supplement 1.
Figure 9—video 2. Structural heterogeneity of myosin-V in the rigor state.
Download video file (29.2MB, mp4)
(A, B) Three-dimensional visualization of the average structure of aged actomyosin-V in the rigor state (myosin: red; F-actin: sea green; PHD: yellow; LC: white). (C) Morph of 3D class average models illustrating the conformational heterogeneity of myosin (classes are ordered by their number; also see Figure 1—figure supplement 1). (D, E) Morph of extreme structures along the first (D) and second (E) principal components; also see Figure 9—figure supplement 1. (F, G) Three-dimensional visualization of the average structure of young actomyosin-V in the rigor state (myosin: red; F-actin: blue; JASP: yellow; LC: white). Morph of 3D class average models (H) and morph of extreme structures along the first (I) and second (J) principal components.
Figure 9—video 3. Structural heterogeneity of myosin-V in the post-rigor transition (PRT) state (AppNHp).
Download video file (16.2MB, mp4)
(A, B) Three-dimensional visualization of the average structure of aged actomyosin-V in the AppNHp-bound PRT state (myosin: purple; F-actin: sea green; PHD: yellow; LC: white). (C) Morph of 3D class average models illustrating the conformational heterogeneity of myosin (classes are ordered by their number; also see Figure 1—figure supplement 1). (D, E) Morph of extreme structures along the first (D) and second (E) principal components; also see Figure 9—figure supplement 1.