. 2021 Dec 31;70(51-52):1773–1777. doi: 10.15585/mmwr.mm705152e1

FIGURE 1.

Figure is a histogram indicating the number of SARS-CoV-2 tests performed and percentage of positive test results in transitional kindergarten through grade 12 public school districts in Los Angeles County, California during August 16–October 31, 2021.

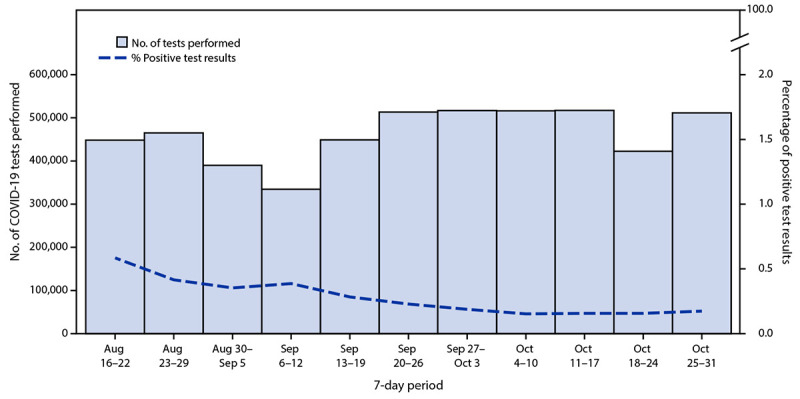
Number of SARS-CoV-2 tests performed and percentage of positive test results* in transitional kindergarten through grade 12 public school districts — Los Angeles County, California, August 16–October 31, 2021

* Weekly data might have included repeat tests for an individual person.