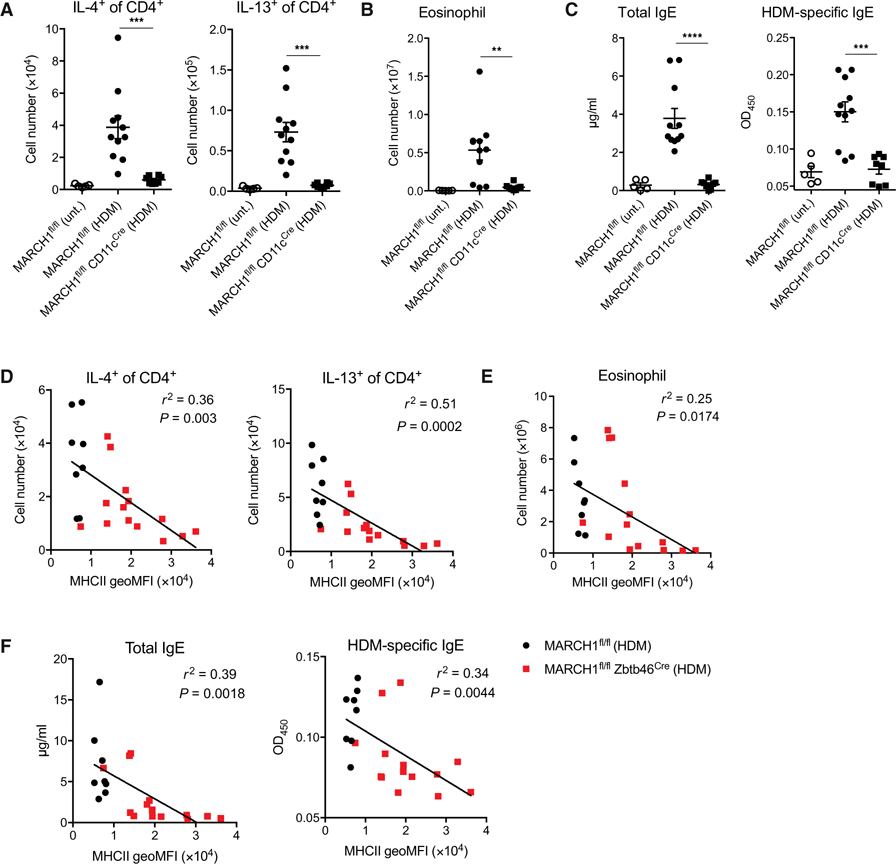
Fig. 2. The role of MARCH1 in promoting TH2 cell immunity depends on its expression by DCs.
(A) Total numbers of IL-4– or IL-13–competent CD4+ T cells in lungs of MARCH1fl/fl or MARCH1fl/fl CD11cCre mice untreated or treated with HDM. (B) Total numbers of eosinophils in lungs. (C) Serological IgE titers and OD values for HDM-specific IgE antibodies as determined by ELISA. Data in (A) to (C) are pooled from two independent experiments with three to six mice administered with HDM and two to three untreated control mice. Data are shown as means ± SEM. Statistical significance was determined by one-way ANOVA with Tukey’s multiple comparisons test. **P < 0.01; ***P < 0.001; ****P < 0.0001. (D to F) Total numbers of IL-4– or IL-13–competent CD4+ T cells (D), eosinophils (E), and serological IgE titers and HDM-specific IgE antibodies (F) in MARCH1fl/fl or MARCH1fl/fl Zbtb46Cre mice treated with HDM. Data are shown in relation to the surface expression of MHCII [geometric mean fluorescence intensity (geoMFI)] in lung DC1 (gated as shown in fig. S1). Data in (D) to (F) are pooled from two independent experiments with each experiment having four to seven mice administered with HDM. Data in (D) to (F) are shown with statistical r2 values, P values, and trend lines determined from linear regression analysis.

