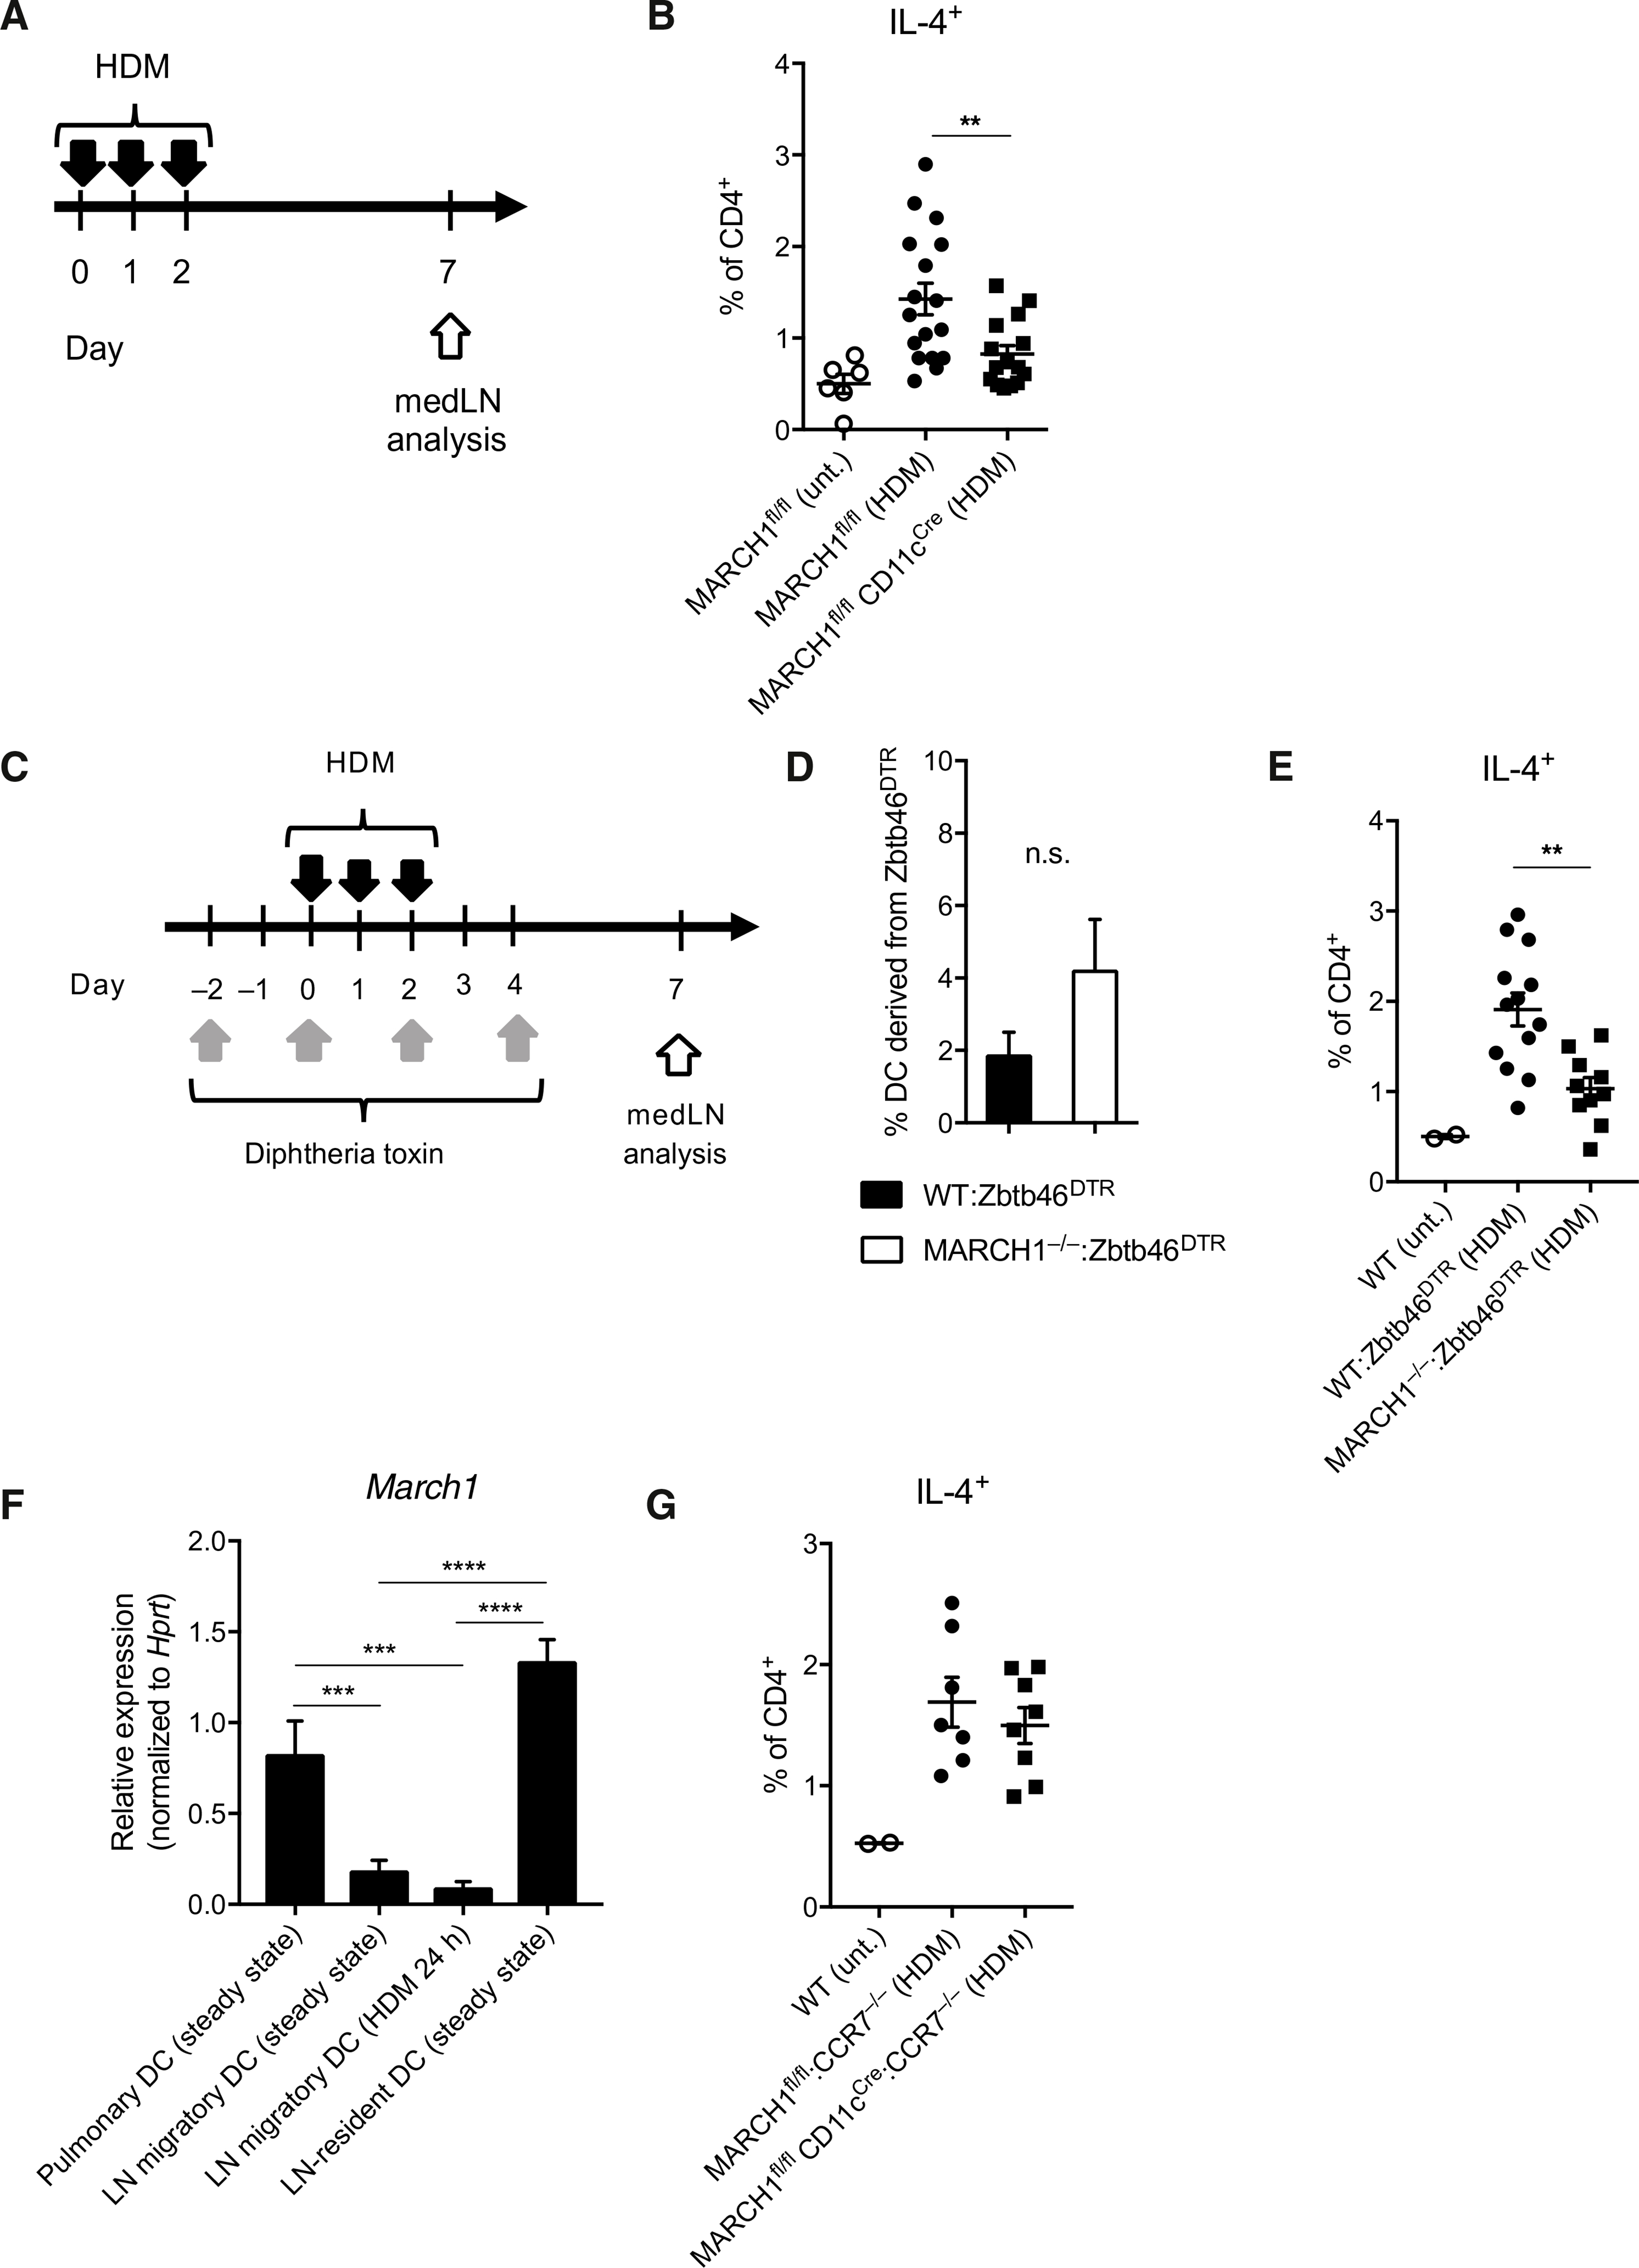
Fig. 3. MARCH1 promotes TH2 cell development through LN-resident DCs.

(A) Experimental outline of HDM administration. Solid black arrows indicate oropharyngeal aspiration of 10 μg of HDM. (B) Percentage of IL-4–competent CD4+ T cells in medLNs of MARCH1fl/fl and MARCH1fl/fl CD11cCre mice. Untreated mice were used as negative controls. Data are pooled from three independent experiments with each experiment having five to six mice per treated group. (C) Experimental outline of DT and HDM treatment for WT:Zbtb46DTR or MARCH1−/−:Zbtb46DTR mixed BM chimeric mice. (D) Percentage of DCs in the medLN derived from the Zbtb46DTR BM after DT treatment of WT:Zbtb46DTR or MARCH1−/−:Zbtb46DTR mixed BM chimeric mice. Not significant (n.s.), P > 0.1. (E) Percentage of IL-4–competent CD4+ T cells in medLNs of WT:Zbtb46DTR or MARCH1−/−:Zbtb46DTR mixed BM chimeric mice after DT and HDM treatment. Untreated mice were used as negative controls. Data are from one experiment with 10 to 12 mice per treated group. (F) March1 mRNA levels in FACS-purified pulmonary or medLN DCs normalized to the levels of Hprt housekeeping gene. Each bar represents at least three measurements. (G) Percentage of IL-4–competent CD4+ T cells in medLNs of MARCH1fl/fl:CCR7−/− or MARCH1fl/fl CD11cCre:CCR7−/− mixed BM chimeric mice. Untreated mice were used as negative controls. Data are from one experiment with seven to eight mice per treated group. Data are shown as means ± SEM. Statistical significance was determined by one-way ANOVA with Tukey’s multiple comparisons test (B and E to G) or unpaired Student’s t test. **P < 0.01; ***P < 0.001; ****P < 0.0001.
