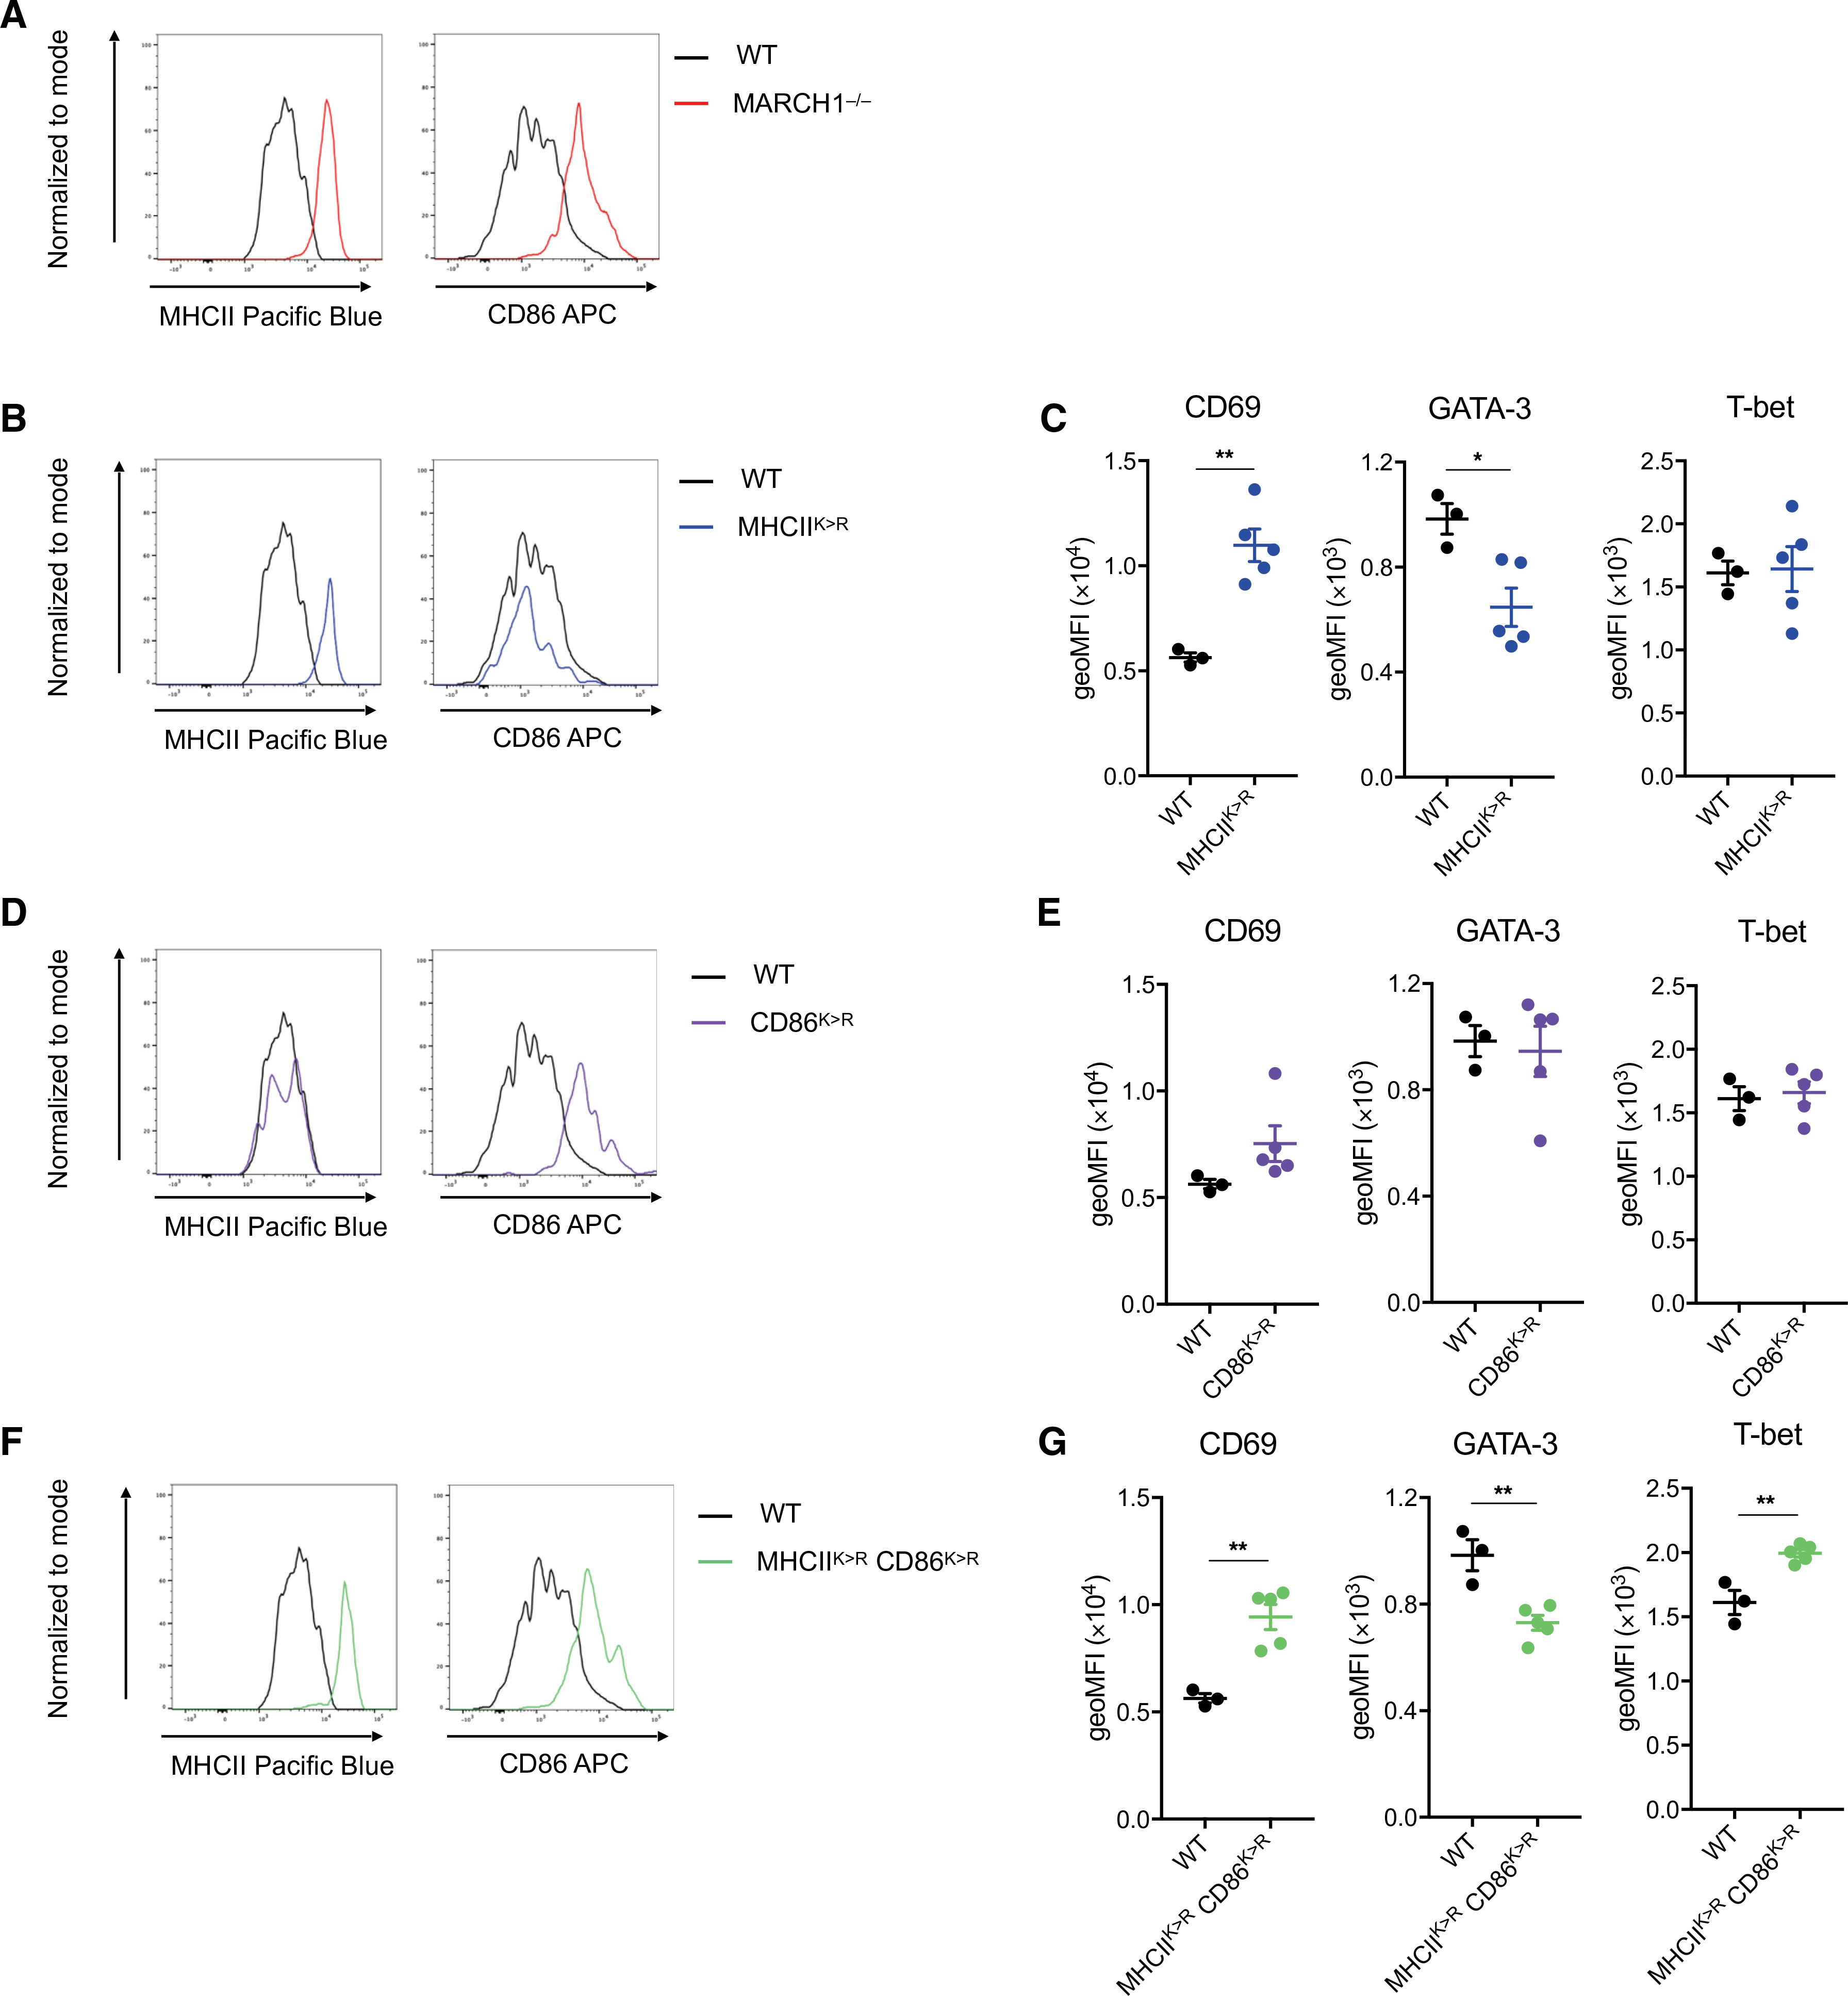
Fig. 5. Ubiquitin-dependent turnover of MHCII and CD86 promotes up-regulation of GATA-3 and down-regulation of T-bet in developing TH2 cells.

(A) Representative histograms showing MHCII and CD86 abundance on the surface of medLN-resident DCs in a MARCH1−/− mouse in comparison to a WT mouse. (B) Representative histograms showing MHCII and CD86 abundance on the surface of medLN-resident DCs in a MHCIIK>R mouse in comparison to a WT mouse. (C) Expression level of CD69, GATA-3, or T-bet in adoptively transferred OT-II cells in medLN of WT or MHCIIK>R mice at 48 hours after challenge with the mixture of HDM and OVA. (D) Representative histograms showing MHCII and CD86 abundance on the surface of medLN-resident DCs in a CD86K>R mouse in comparison to a WT mouse. (E) Expression level of CD69, GATA-3, or T-bet in adoptively transferred OT-II cells in medLN of WT or CD86K>R mice at 48 hours after challenge with the mixture of HDM and OVA. (F) Representative histograms showing MHCII and CD86 abundance on the surface of medLN-resident DCs in a MHCIIK>RCD86K>R mouse in comparison to a WT mouse. (G) Expression level of CD69, GATA-3, or T-bet in adoptively transferred OT-II cells in medLN of WT or MHCIIK>RCD86K>R mice at 48 hours after challenge with the mixture of HDM and OVA. Data in (A), (B), (D), and (F) are obtained from one experiment with one mouse per genotype. Data in (C), (E), and (G) are obtained from one experiment with three to five mice per group. Data are shown as means ± SEM. Statistical significance was determined by unpaired Student’s t test. *P < 0.05; **P < 0.01.
