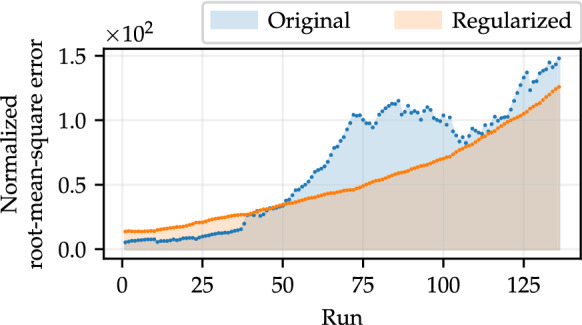
Fig. 3.

NRMSEs computed by comparing simulations of the SEIRPD-Q model, performed using parameters that best fit the training data, where , in relation to the test set (composed of 14 points). The area under the curve represents the total deviation relative to the test data in all runs, where the number of training data varies. (Color figure online)
