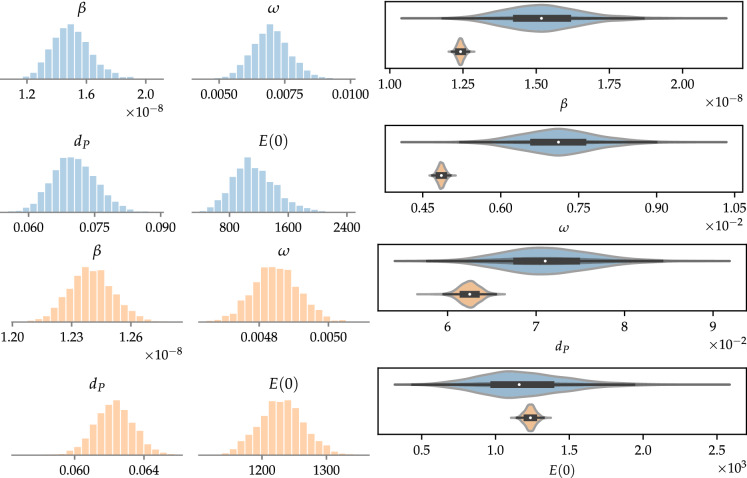
Fig. 5.
The left frame shows the posterior distribution of the parameters obtained in the Bayesian inference for original (in blue) and regularized (in orange) data, by fitting the daily number of infected and dead individuals; the right frame illustrates the variance of each parameter in a comparative way, where the same color scheme is adopted. (Color figure online)

