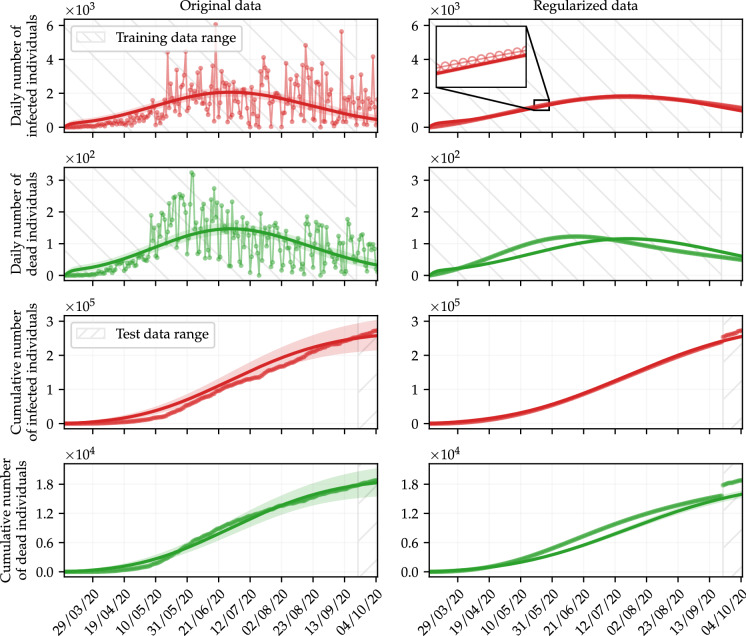
Fig. 6.
Simulations with parameters obtained by fitting the daily number of infected (in red) and dead (in green) individuals using the Bayesian approach. The shaded areas refer to the 95% CI (see Table 2). Hatched areas bound the range of training and test data. Training data is never regularized. (Color figure online)

