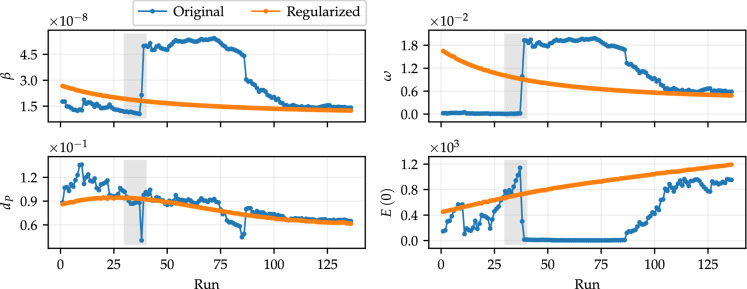
Fig. 7.
Optimal parameters obtained by fitting the daily data of infected and dead individuals, for . Each run is associated with a training set with a specific size, from 60 to 196 data in each set. The test data refer to the 14 subsequent data from the corresponding run. Parameters obtained by fitting original data are shown in blue, and regularized data are shown in orange. (Color figure online)

