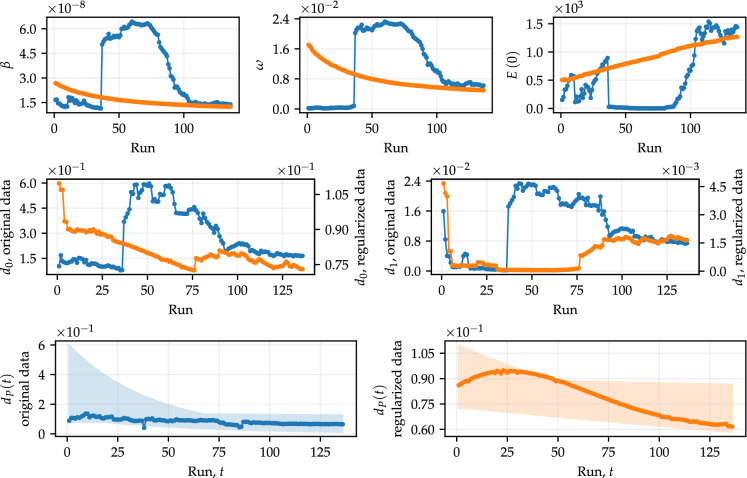
Fig. 9.
Optimal parameters obtained in a procedure similar to that of Fig. 7, for . We also show the interval that includes the curves of , for each optimal value of and associated with the same run. In addition, we also show the optimal values of presented in Fig. 7, for purposes of comparison with the curves of

