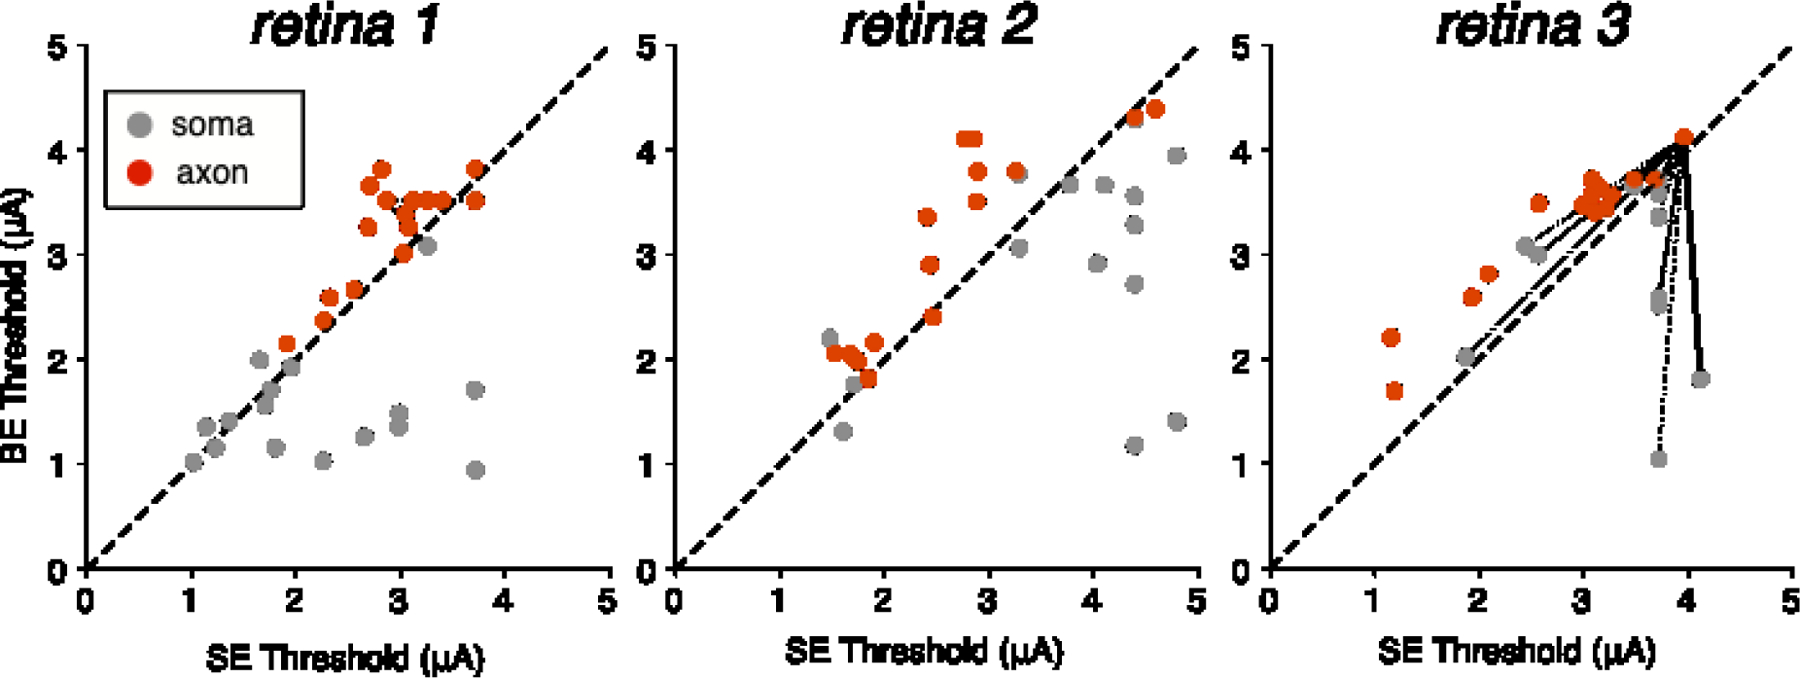
Figure 2. Axonal and somatic activation thresholds from bi-electrode and single-electrode stimulation.

Scatter plots for three preparations show activation threshold of analyzed cells to bi-electrode (BE) and single-electrode (SE) stimulation. Dashed diagonals denote equality. An example of the “surrogate” analysis method (see Results) is illustrated in retina 3: dashed lines show all possible pairings between a non-target axon and all somas; solid line denotes a soma-axon pair targeted by the same set of electrodes. Data are shown from 40 distinct cells and 192 distinct cell-electrode pairs across the three retinal preparations.
