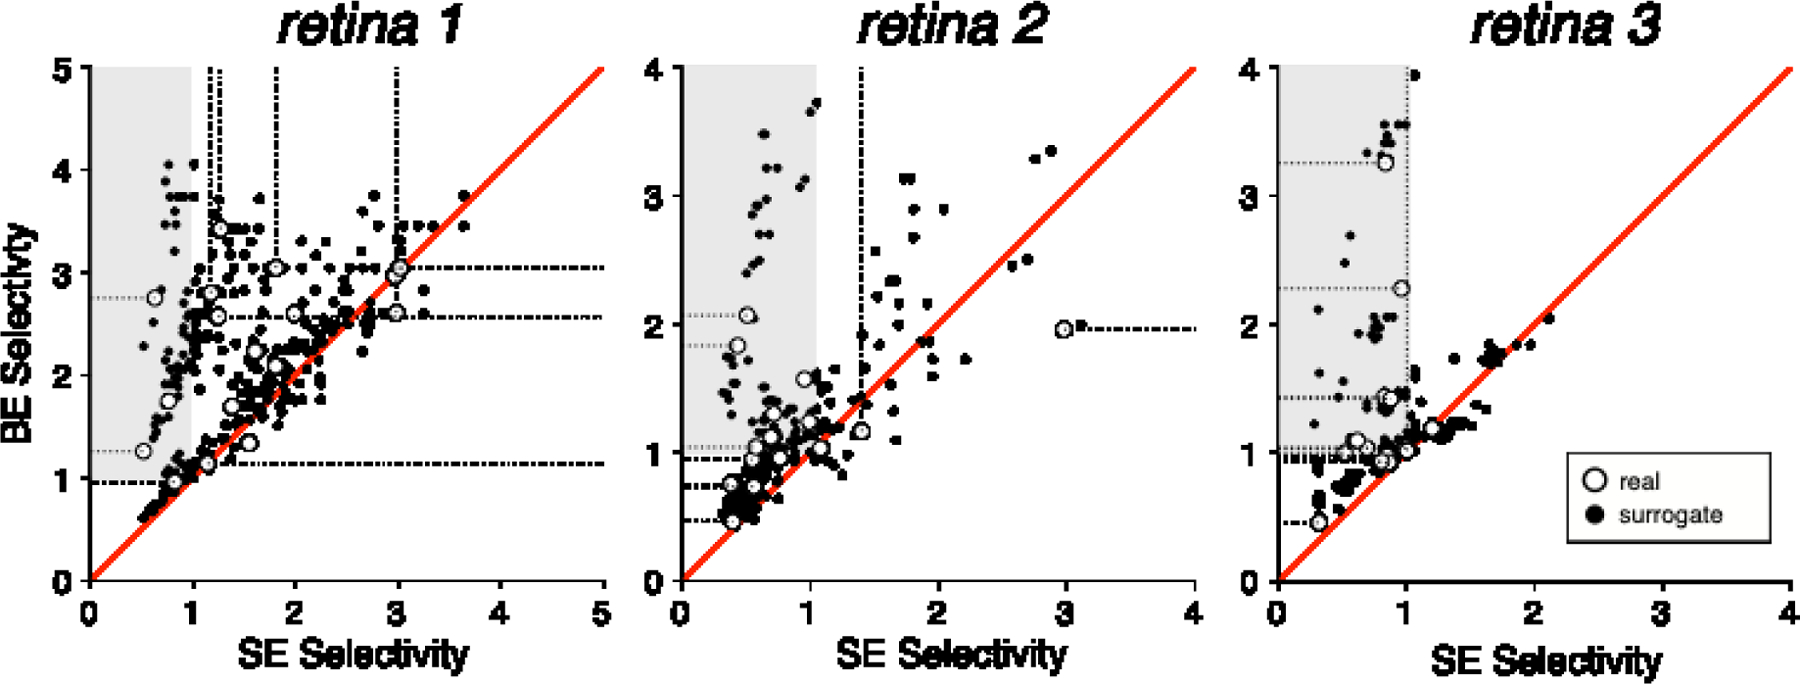
Figure 3. Impact of bi-electrode stimulation on selectivity.

Scatter plots with each point representing selectivity calculated for a target soma (gray points, Fig. 2) and non-target axon (red points, Fig. 2) pair with bi-electrode (BE) and single-electrode (SE) stimulation in three retinas. Red diagonals denote equality. Shaded region represents regions of rescued selectivity (Fig. 4). Open symbols with dotted tails represent scenarios in which the target soma or non-target axon did not spike at the maximum supplied current amplitude. In these cases selectivity was calculated with the threshold set to the largest current amplitude tested, and the tail shows the possible range of true selectivity for larger thresholds.
