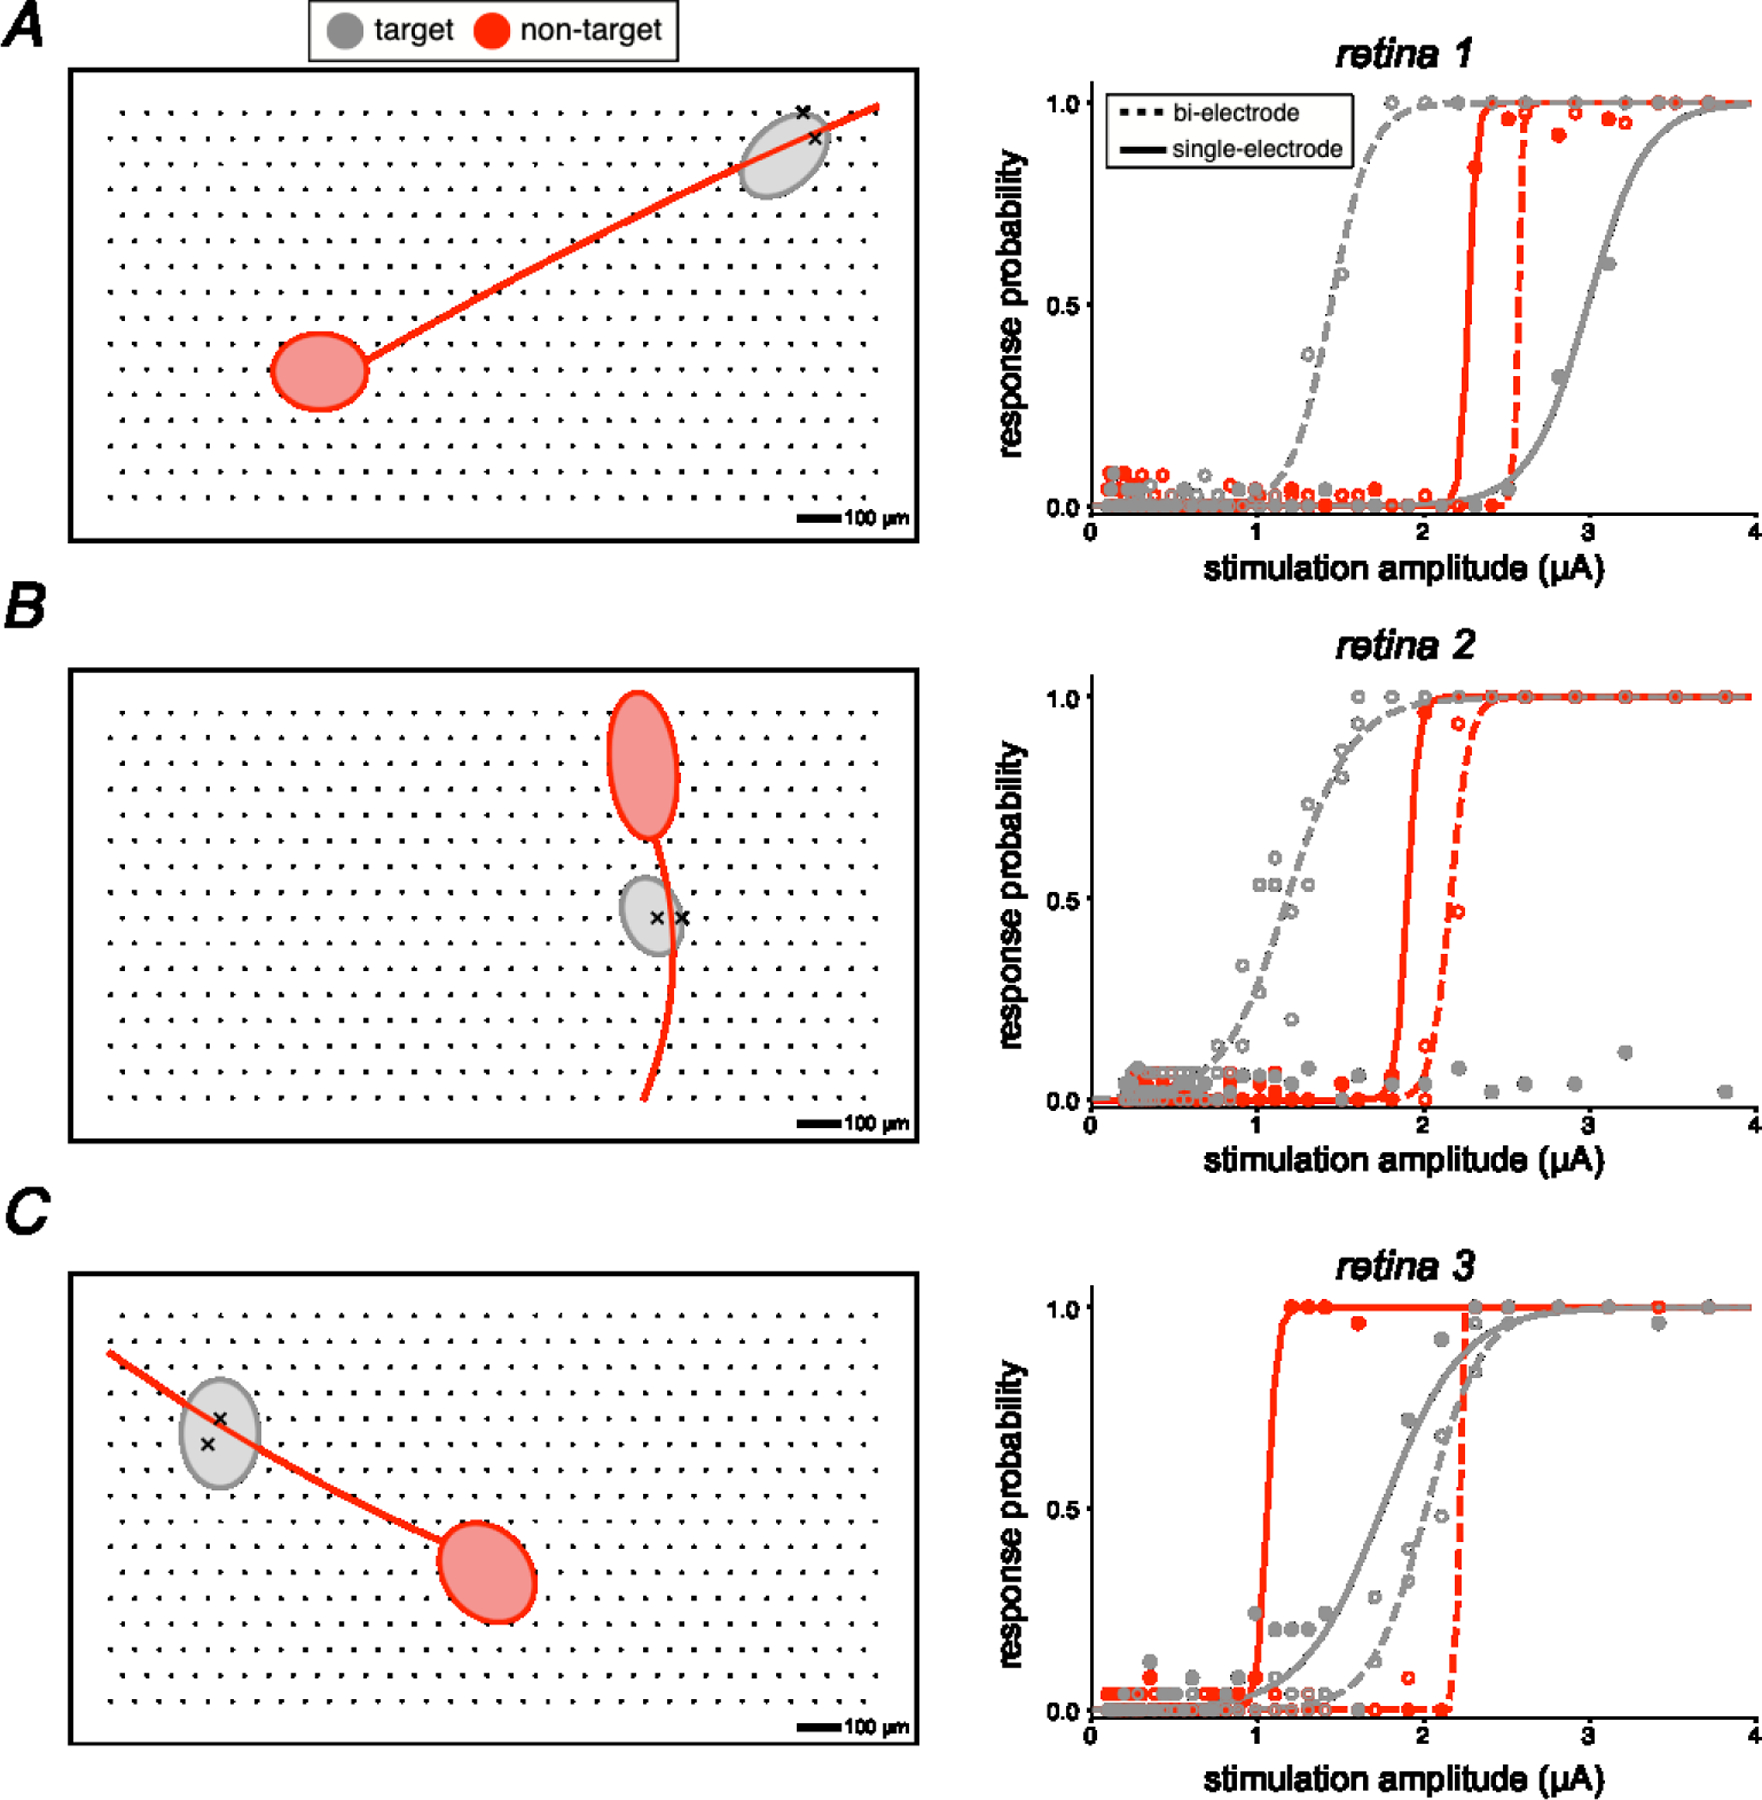
Figure 4. Electrical images and activation curves for target somas and non-target axons exhibiting rescued selectivity.

Each panel on the left shows a simplified electrical image of the axonal and somatic compartments of a recorded cell over a region of the electrode array. Each panel on the right shows the observed activation curves for the target and non-target cell, using bi-electrode and single electrode stimulation. In all cases, bi-electrode stimulation resulted in selective activation of the target soma, at a lower current level than the threshold for the non-target axon, which was not possible with single electrode stimulation. Soma-axon pairs A, B, and C were from retina 1, 2, and 3, respectively.
