
Fig.1. Changes in Japanese TC, non-HDL-C, and LDL-C levels during school-age.
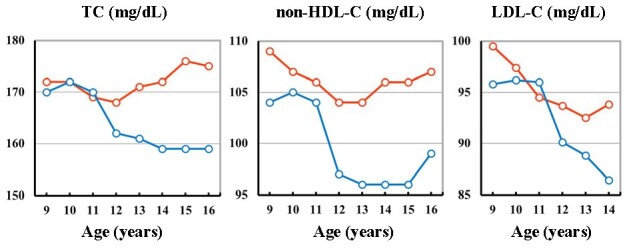
The 50th percentile values of TC, non-HDL-C, and LDL-C at each age were plotted in Japanese boys (blue line) and girls (red line). Data were from a nationwide survey by Abe et al. 4) for TC and non-HDL-C and data by Okada et al. 2) for LDL-C.