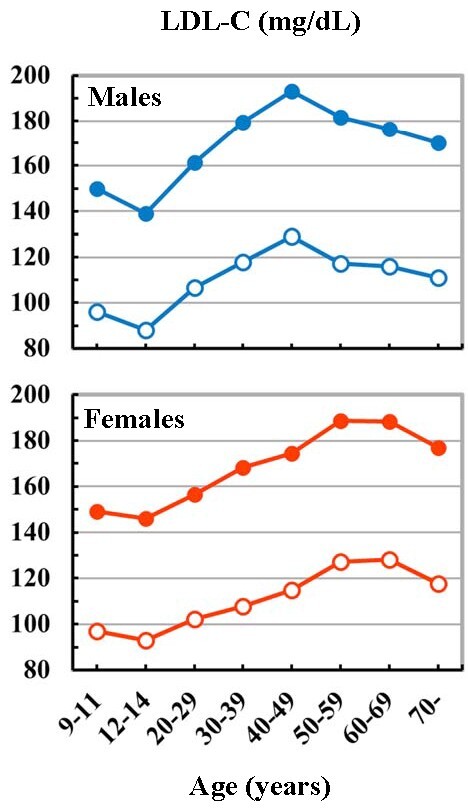
Fig.2. Japanese LDL-C levels with age.

The graphs are two combined data. The children’s data are from the survey by Okada et al. 2) , and the adult’s data are from the National Health and Nutrition Survey in Japan, 2018 (Ministry of Health, Labour and Welfare, Japan) 9) .
Blue lines: boys and males. Red lines: girls and females. Closed circles: the 97th percentile values (<15 years) and mean+2SD (97.7th percentile) values (≥ 20 years). Open circles: the 50th percentile values.
