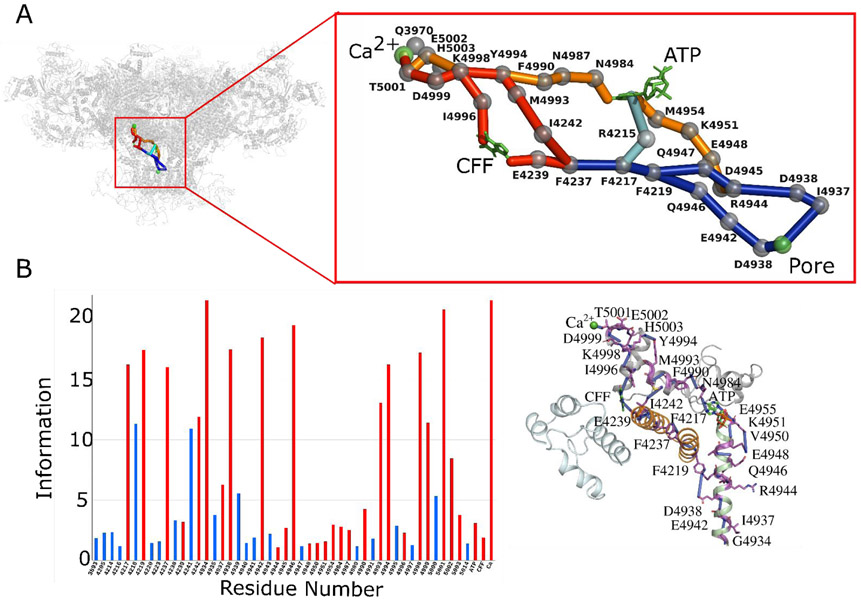
Fig. 4. Co-regulation interactions in Ca2+/ATP/CFF bound-closed RyR1 structure (PDB ID: 5TAQ).
(A) The detailed network of allosteric connections among the three ligand sites (CFF, ATP, and Ca2+) and the pore region in Ca2+/ATP/CFF bound-closed RyR1 structure. Protein is shown in transparent gray cartoon representation, ATP and CFF are shown in green licorice, and Ca2+ and pore lining residue Gly-4934 are as green spheres. Color code for allosteric pathways shown in this figure is as follows: Ca2+-pore and Ca2+-CFF-pore in red and blue, Ca2+-ATP-pore in orange and blue, and CFF-ATP in cyan. Cα atoms of allosteric information passing residues (hot spot residues) are as gray spheres. (B) Allosteric communication between Ca2+, ATP and CFF binding sites and pore region. Bars corresponding to residues participating in most optimal allosteric pathway between binding sites and pore region are highlighted in red. Bars for residues participating in other possible but least significant pathways are colored in blue. The height of bars in each chart represents the extent of allosteric information transmitted through the corresponding residue. The interactions between residues participate in allosteric communication between ligand sites are rendered as blue cylinders. Color code for RyR1 domains participating in allosteric communication among the ligand sites is as follows: TaF domain (4175–4253) in orange, Helical-bundle domain between S2 and S3 (4666–4786) in cyan, channel pore domain (4820–4956) in green, and CTD (4957–5037) in gray. ATP and CFF are shown in green licorice representation, and Ca2+ is shown in green van der Waals representation.

