. 2021 Oct 11;20(1):114–126. doi: 10.1158/1541-7786.MCR-21-0277

Figure 6.

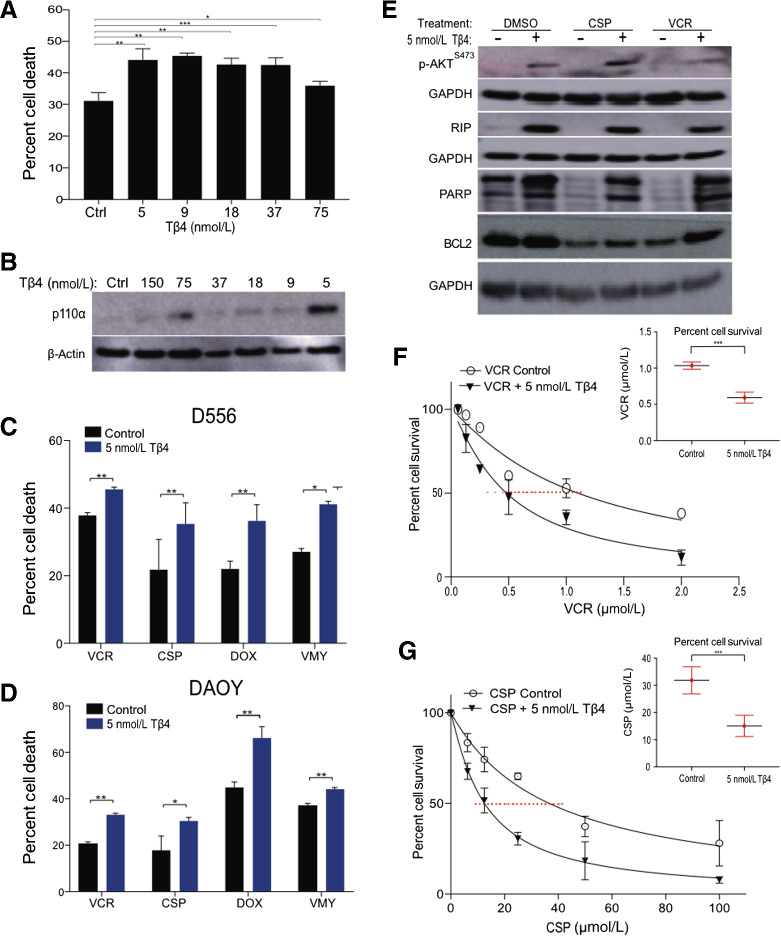
Figure 6. Tβ4 enhanced chemosensitivity in medulloblastoma cells. A, Dose–response survival curves as assessed by trypan blue (average ± SD of N = 3 separate experiments) of D556 cells treated with doxorubicin (DOX, 4.5 μmol/L) and Tβ4 at concentrations shown. B, Immunoblots of p110α levels and β-actin in the cells from A. Cell survival of D556 (C) and DAOY (D) in response to the VMY (30 μmol/L), doxorubicin (4.5 μmol/L), vincristine (0.5 μmol/L), and cisplatin (12.5 μmol/L) in presence or absence of 5 nmol/L Tβ4 as measured by trypan blue. E, Immunoblots of p-AKTS437 and RIP levels in D556 cells treated as shown. EC50 dose–response experiments performed on D556 cells treated with vincristine (F) and cisplatin (G) in presence or absence of Tβ4. Insets; EC50 values of D556 cells treated as shown. Data are mean ± SD of three independent experiments. P: *, <0.05; **, <0.01; ***, <0.001.

Tβ4 enhanced chemosensitivity in medulloblastoma cells. A, Dose–response survival curves as assessed by trypan blue (average ± SD of N = 3 separate experiments) of D556 cells treated with doxorubicin (DOX, 4.5 μmol/L) and Tβ4 at concentrations shown. B, Immunoblots of p110α levels and β-actin in the cells from A. Cell survival of D556 (C) and DAOY (D) in response to the VMY (30 μmol/L), doxorubicin (4.5 μmol/L), vincristine (0.5 μmol/L), and cisplatin (12.5 μmol/L) in presence or absence of 5 nmol/L Tβ4 as measured by trypan blue. E, Immunoblots of p-AKTS437 and RIP levels in D556 cells treated as shown. EC50 dose–response experiments performed on D556 cells treated with vincristine (F) and cisplatin (G) in presence or absence of Tβ4. Insets; EC50 values of D556 cells treated as shown. Data are mean ± SD of three independent experiments. P: *, <0.05; **, <0.01; ***, <0.001.