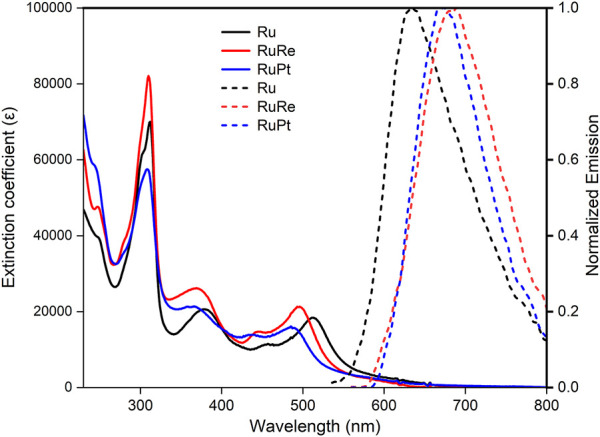
FIGURE 2.

UV-Vis absorption of Ru (black), RuRe (red) RuPt (blue) and normalized emission spectra of Ru (dashed black), RuRe (dashed red), RuPt (dashed blue). UV-Vis spectra were collected using a 0.025 mM solution of the complexes in aerated acetonitrile in a 1 cm path length cell. Emission spectra were collected in a 1 cm pathlength cell at 490 nm excitation with all complexes having an absorbance of 0.1 at 490 nm.
