
FIGURE 6.
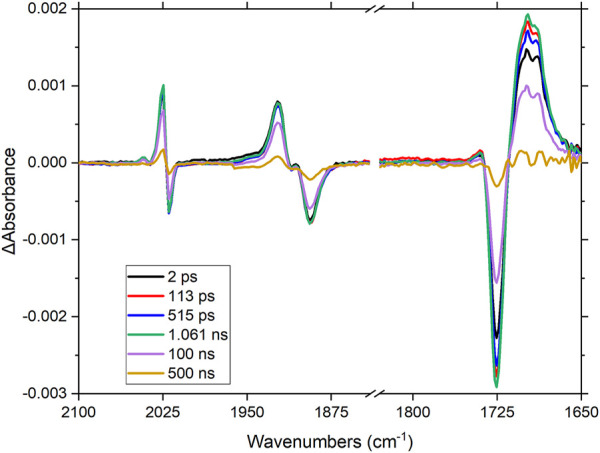
Time-resolved infrared spectrum following excitation of RuRe in CH3CN-d3 at 510 nm (1 μJ). Note-the spectra were collected using two separate solutions, indicated by the dash in the axis.
Official websites use .gov
A
.gov website belongs to an official
government organization in the United States.
Secure .gov websites use HTTPS
A lock (
) or https:// means you've safely
connected to the .gov website. Share sensitive
information only on official, secure websites.
Time-resolved infrared spectrum following excitation of RuRe in CH3CN-d3 at 510 nm (1 μJ). Note-the spectra were collected using two separate solutions, indicated by the dash in the axis.