Fig. 2.
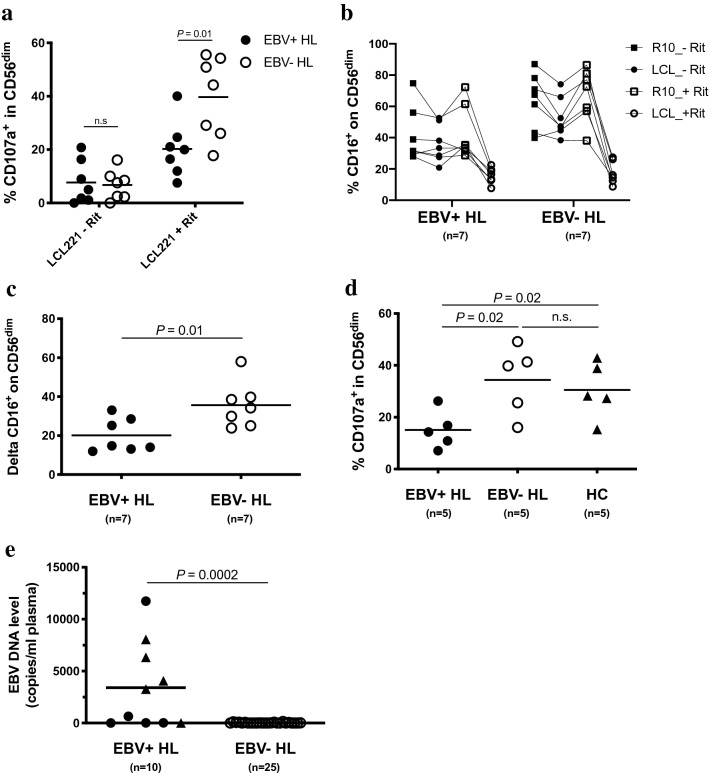
Impaired rituximab-induced degranulation in CD56dim NK cells from EBV+ HL compared to EBV- HL patients. Overnight rIL-2-pre-stimulated PBMCs from 7 EBV+ HL and 7 EBV- HL patients were co-cultured with LCL721.221 cell line (LCL221) without or with 1 μg/ml of rituximab (Rit) at an effector to target ratio of 10:1 for 5 h. Frequencies of degranulating CD107a+ cells within CD56dim NK cells a of EBV+(filled circles) and EBV-(open circles) HL patients. b Frequencies of CD16+ cells within CD56dim of EBV+ and EBV- HL patients in different experimental conditions (medium control or LCL221; without or with 1 μg/ml rituximab). c CD16 downregulation between the condition LCL221 without rituximab (LCL_-Rit in Fig. 2b) and LCL221 with rituximab (LCL_+Rit) is depicted as delta. d PBMCs of 5 EBV+ HL, 5 EBV- HL patients and 5 healthy controls (HC) were thawed, incubated overnight without rIL2 pre-stimulation and co-cultured the next day with LCL221 in the presence of 1 μg/ml of rituximab at an effector to target ratio of 10:1 for 5 h. Frequencies of degranulating CD107a+ cells within the CD56dim NK cells of EBV+ HL (filled circles), EBV- HL (open circles) and HC (triangles). e Plasma EBV DNA levels (copies/ml of plasma) of EBV+ (filled circles, n=10) and EBV-seropositive EBV- (open circles, n=25) HL patients. EBV+ HL patients were further delineated according to the clinical stage, i.e., early stage I and II (filled circles) vs. advanced stage III and IV (filled triangles). Horizontal lines indicate the mean value in Fig. 2a-e. Displayed P values were determined by unpaired t test for comparison of 2 groups (Fig. 2a, c and e), by the one-way ANOVA test with Tukey’s multiple comparisons test for comparison of 3 groups (Fig. 2d) and by the paired t test for paired samples (Fig. 2b)

