Fig. 1.
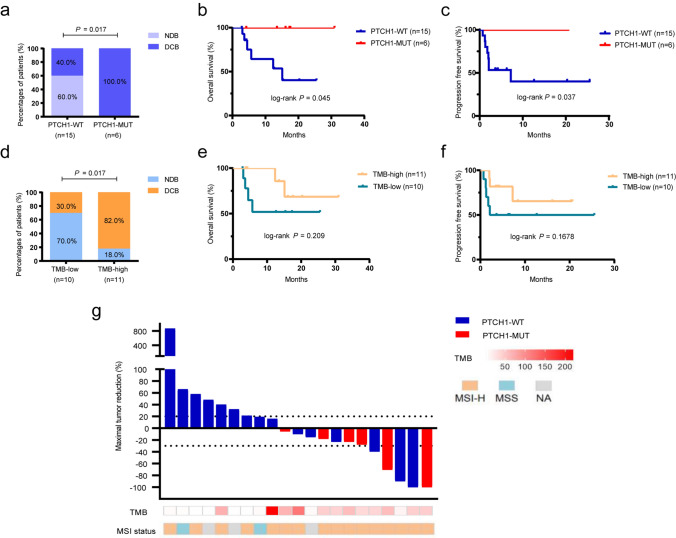
PTCH1 and TMB status correlate with the response to ICI treatment in our cohort a Comparison of the DCB rates in the PTCH1 mutation and PTCH1 wild-type groups. b and c Kaplan–Meier curves comparing OS (b) and PFS (c) in patients with the PTCH1 mutation and wild-type PTCH1 in our cohort. d Comparison of the DCB rates in the TMB-low and TMB-high groups. e and f Kaplan–Meier curves comparing OS (e) and PFS (f) of the TMB-high and TMB-low patients. The cutoff value for TMB-high and TMB-low was defined as 37 mutations/Mb. g Waterfall plot representing the best change from baseline in sum of longest target lesion diameters per patient based on PTCH1, TMB, and MSI status. PTCH1, Patched1 gene; DCB, durable clinical benefit; OS, overall survival; PFS, progression-free survival; TMB, tumor mutational burden; MSI, microsatellite instability

