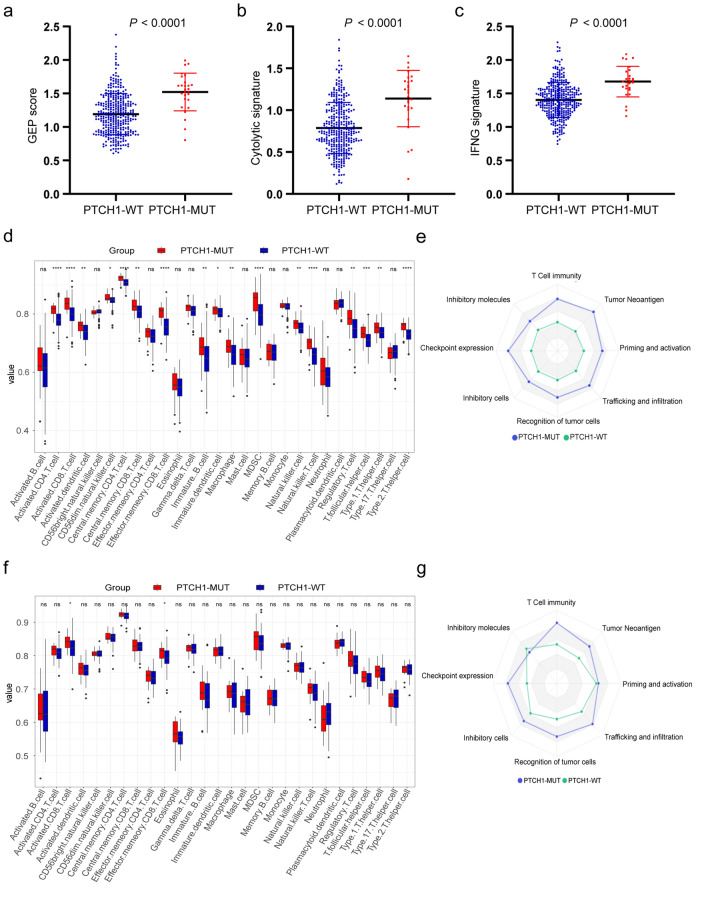
Fig. 3.
Correlation between PTCH1 mutation and immune-related signatures in the TCGA cohort a–c Quantitative analysis of GEP scores (a), Cytolytic (b) and IFNG (c) signatures in the PTCH1 mutation and PTCH1 wild-type patients based on the TCGA COADREAD database. d and f Boxplots show the abundance of ssGSEA-derived immune cells in multiple cell subsets based on PTCH1 mutation status in the TCGA COADREAD cohort (d) and its MSI-H subgroup (f). e and g Eight axes of an immunogram involving the cancer-immunity cycle were plotted based on the PTCH1 mutation status in the TCGA COADREAD cohort (e) and its MSI-H subgroup (g). The value of the immunogram score (IGS) was calculated using GSVA. GEP, gene expression signature; GSVA, Gene Set Variation Analysis

