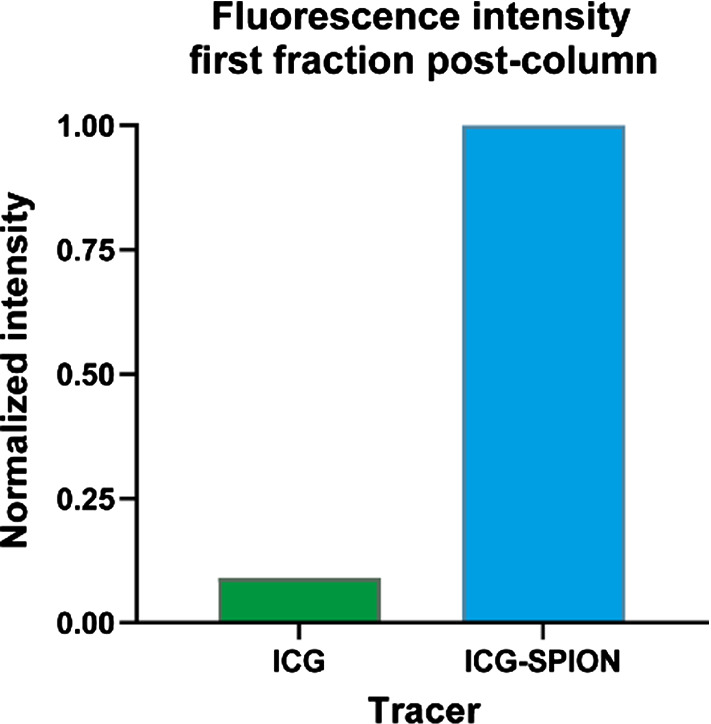
Fig. 2.

Visualization of the size-exclusion column measurements for ICG-SPION. Fluorescence intensity is shown of the first fraction after purification of a column with ICG and a column with ICG-SPION. This clearly shows a rise of fluorescence emission at 810 nm for ICG-SPION, indicating that at least part of the ICG has bound non-covalently to the SPION particles. The intensity values were corrected by subtracting the SPION background intensity and normalized to that of ICG-SPION
