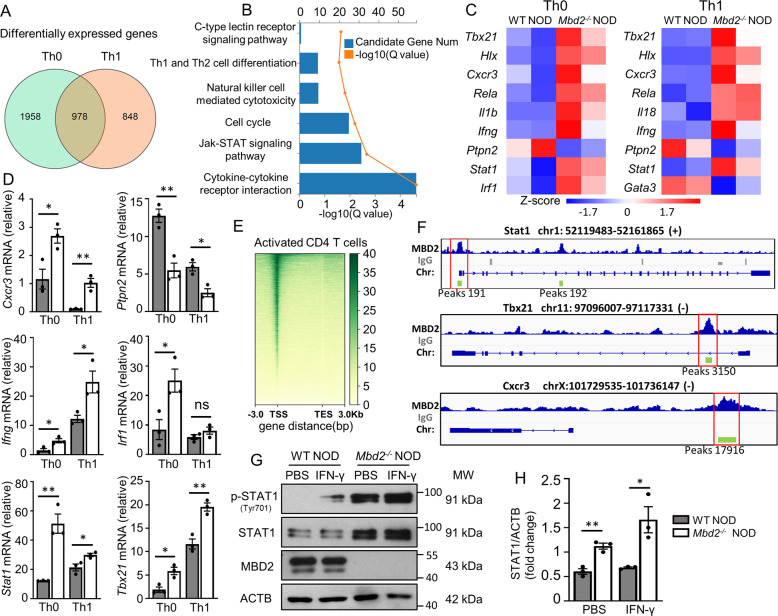
Fig. 5. Mbd2 deficiency upregulates Th1 signature genes.
A RNA sequencing revealed differentially expressed genes (DEGs) of Th0 and Th1 subsets. Two biological replicates for each group, and there were two mice for each biological replicate. B KEGG pathway enrichment analysis on significantly altered genes between polarized WT and Mbd2−/− Th1 cells. C The representative heatmap results for differentially expressed genes of WT or Mbd2−/− Th0 and Th1 cells. D Real-time PCR validation for the selected Th1 signature genes in WT or Mbd2−/− Th0 and Th1 cells (three mice per group). E Heatmap for the distribution of MBD2 binding sites detected by CUT&Tag assay in activated CD4 T cells. TSS transcription start site, TES transcription end site. F Genomic binding patterns of the Stat1, Tbx21, Cxcr3 locus showing the MBD2-binding locations. Encircled rectangle: promoter binding sites. G Western blot analysis and the H quantitative results of STAT1 and p-STAT1 expression in isolated CD4 T cells following IFN-γ stimulation for 15 min or not (three mice per group). All in vitro studies were repeated at least three times. Data are expressed as mean ± SEM. Statistical significance was analyzed by unpaired Student’s t test. *p < 0.05, **p < 0.01. ns not significant.

