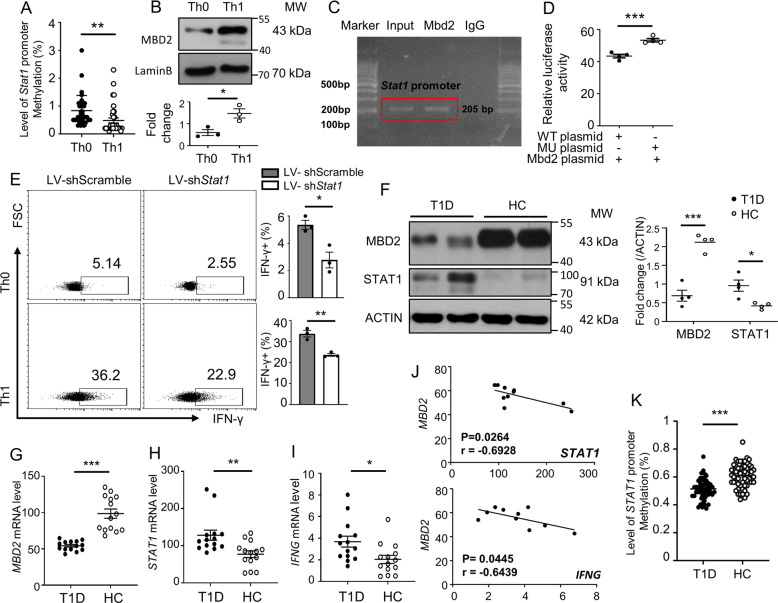
Fig. 6. MBD2 represses the STAT1-IFNγ axis in both mouse and human CD4 T cells.
A DNA methylation level of the predicted CpG islands of Stat1 promoter in Th0 and Th1 cells (35 sites were included). B Representative western blot analysis and quantification of MBD2 expression in differentiated Th0 and Th1 cells (n = 3). C ChIP-PCR to explore the binding of MBD2 to the Stat1 promoter region. D DNA methylation-dependent luciferase report assays conducted in HEK 293T cell line (n = 4). E Mbd2−/− naïve CD4 T cells were transduced with either scramble LV-shRNA or Stat1 LV-shRNA and then cultured under Th0 and Th1 conditions to check the expression of IFN-γ (n = 3). F Representative results for Western blot analysis of MBD2 and STAT1 expression in CD4 T cells isolated from T1D patients (n = 4) and healthy controls (HC) (n = 4). Real-time PCR for analysis of G MBD2, H STAT1, and I IFNG expression in CD4 T cell isolated from T1D patients (n = 14) and HC (n = 14). J Correlation between MBD2 with either STAT1 or IFNG gene expression in CD4 T cells of T1D patients. K Result for the total methylation level of the STAT1 promoter in CD4 T cells from T1D children (n = 11) and healthy controls (n = 8). All in vitro studies were repeated at least 3 times. Data are expressed as mean ± SEM. Statistical difference was analyzed by unpaired Student’s t test. *p < 0.05, **p < 0.01, ***p < 0.001. Pearson’s correlation analysis was applied for (J).

