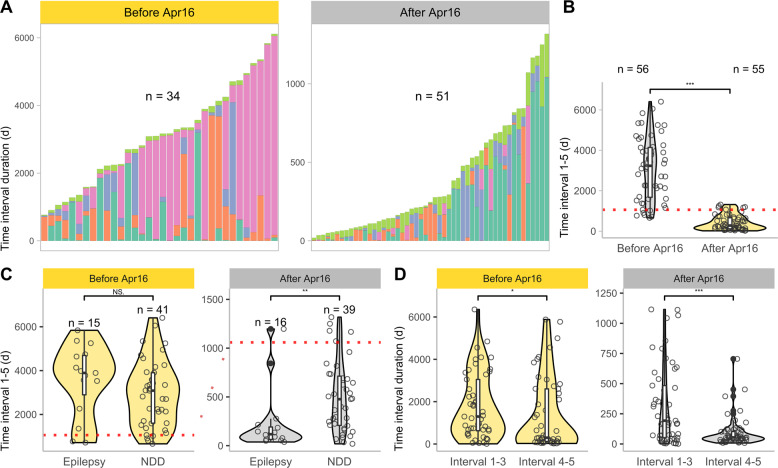
Fig. 3. Impact established NGS-based diagnostics on diagnostic time intervals.
A Stacked bar plot showing the length of each diagnostic subinterval (Interval 1, 2, 3, 4, and 5) per individual, grouped by time of first symptom onset. Cohort is subdivided by availability of NGS-based diagnostics after April 1, 2016. Only individuals for which the duration of all diagnostic intervals could be calculated were included for this figure (n = 84). Colors as in Fig. 1B. B Violin- and scatter-plot of the total diagnostic time interval (Interval 1–5, first symptoms to final diagnosis) grouped by first symptom onset. (p < 0.001, Wilcox-Test). C Violin- and scatter-plot assembling the total diagnostic time interval (Interval 1–5) grouped by phenotype according to the time of onset of first symptoms. Individuals with a combination of both phenotypes were assigned to the phenotype that occurred first. (After Apr16: p ~ 0.002, Wilcox-Test). D Violin- and scatter-plot assembling Interval 1–3 (first symptoms to initiation of first genetic diagnostics) and Interval 4–5 (initiation of first genetic diagnostics to final diagnosis) grouped by onset symptoms. (After Apr16: p < 0.001, Wilcox-Test).

