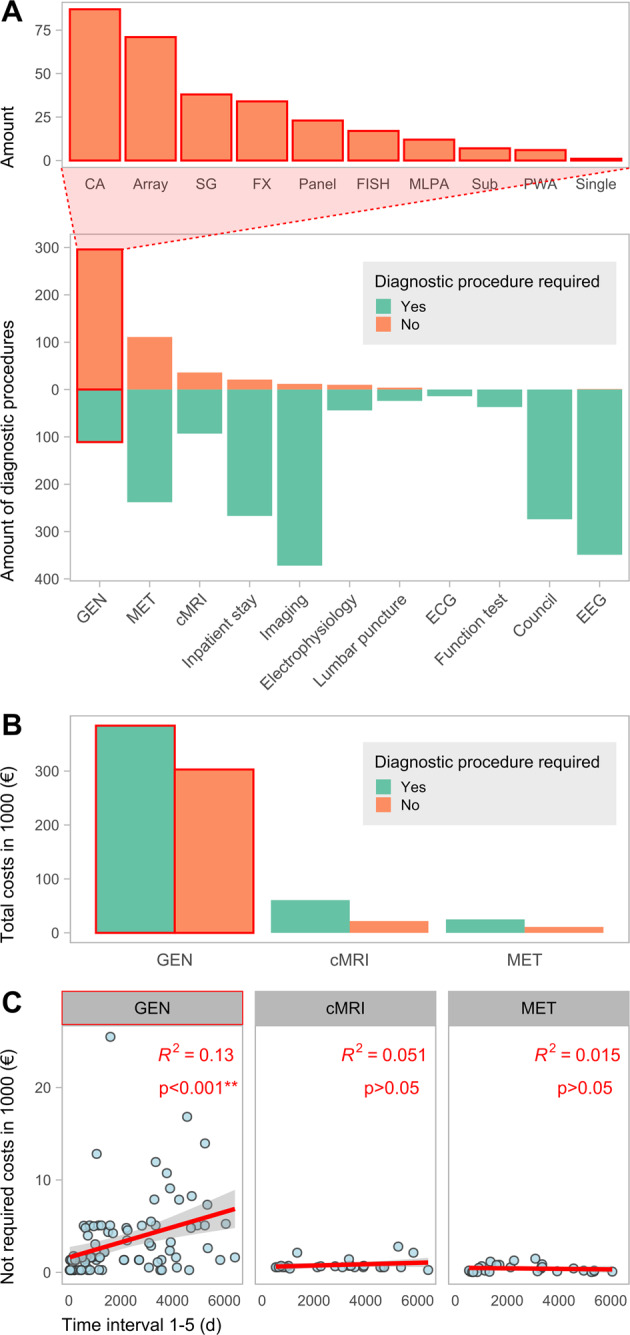
Fig. 4. Required and non-required diagnostic costs.

A Divergent plot illustrating the amount of required and not required diagnostics performed on the individuals. GEN = human genetic diagnostics, MET = metabolic laboratory testing, cMRI = cranial magnetic resonance imaging, Imaging = other medical imaging than cMRI, ECG = electrocardiogram, EEG = electroencephalogram. The bar chart above categorizes the non-required genetic diagnostics. CA = Chromosome analysis, SG = Single Gene analysis, FISH = Fluorescence in situ hybridization, MLPA = Multiplex ligation-dependent probe amplification, Sub = Analysis of Subtelomeres, PWA = Prader-Willi syndrome and Angelman syndrome diagnostics, Single = Single Exome Diagnostics. B Bar chart showing the respective costs grouped by top three diagnostic categories (with the highest amount of potential non-required diagnostics) and requirement. Compare Supplementary Fig. S7 for a cost calculation that excludes external costs. C Scatter-plot showing the correlation of the respective unnecessary diagnostic costs with the length of the diagnostic odyssey (Interval 1–5), grouped by diagnostic category. The values for R2 and the p values are given in the plot.
