Fig. 1.
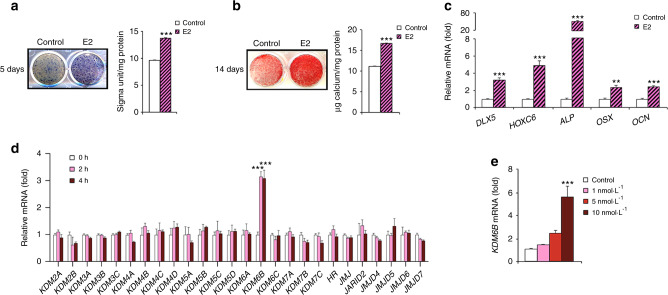
E2 increases osteogenic differentiation and induces KDM6B in DMSCs. a Alkaline phosphatase staining and quantification after 5 days of treatment in osteogenic media with and without E2. b Alizarin Red S staining and quantification after 14 days of treatment in osteogenic media with and without E2. c qRT-PCR of osteogenic genes (DLX5, HOXC6, ALP, OSX, OCN) upon E2 treatment in DMSCs. d qRT-PCR of epigenetic regulatory genes upon E2 (10 nmol·L–1) treatment at 2 and 4 h in DMSCs. e qRT-PCR of KDM6B in different E2 concentrations (1, 5, 10 nmol·L–1) at 2 h. Data are presented as the mean ± SEMs (a, b, n = 9, c–e n = 3). For a and b, the control and E2-treated cells were compared by the two-tailed t test. For c and d, data are shown as fold expression of target genes after normalization to the control. For c, control and E2-treated cells were compared by two-tailed t-tests. For d, the groups were compared by two-way ANOVA with a Bonferroni post hoc test. For e, the groups with different concentrations of E2 were compared by one-way ANOVA with Tukey’s post hoc test. Asterisks were assigned to P values with statistical significance (**P < 0.01; ***P < 0.001)

