Fig. 3.
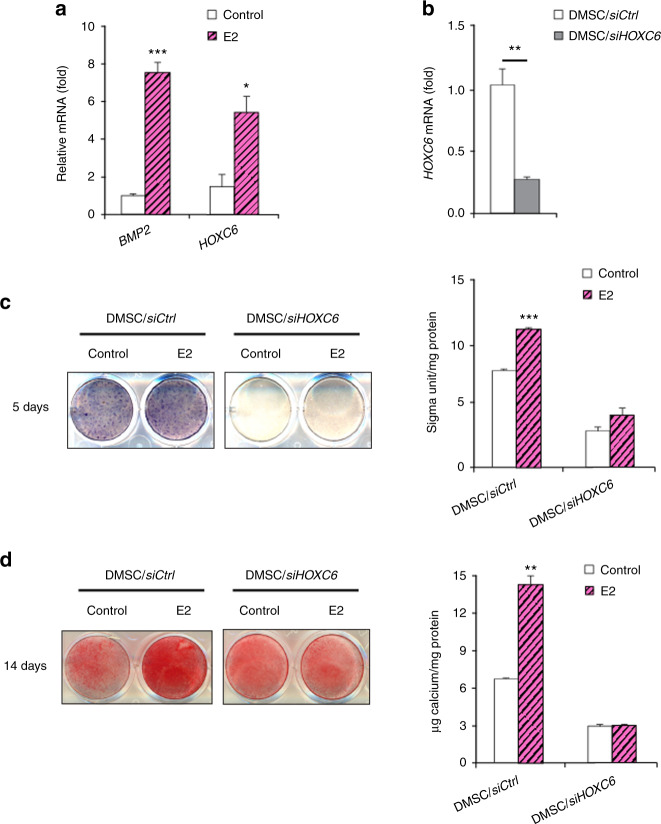
E2-induced BMP and HOXC6 expression in DMSCs. a qRT-PCR of BMP2 and HOXC6 at 4 h upon E2 treatment in DMSCs. b Depletion of HOXC6 in DMSCs via siRNA by qRT-PCR. c Alkaline phosphatase staining and quantification of HOXC6-depleted DMSCs after 5 days of treatment in osteogenic media with and without E2. d Alizarin Red S staining and quantification of HOXC6-depleted DMSCs after 14 days of treatment in osteogenic media with and without E2. Data are presented as the mean ± SEM (n = 3). For a, data are shown as fold expression of target genes after normalization to the control. For b, data are shown as fold expression of target genes after normalization to DMSC/siCtrl. For a and b, two groups were compared by two-tailed t-tests. For c and d, all groups were compared by two-way ANOVA with a Bonferroni post hoc test. Asterisks were assigned to P values with statistical significance (*P < 0.05; **P < 0.01; ***P < 0.001)

