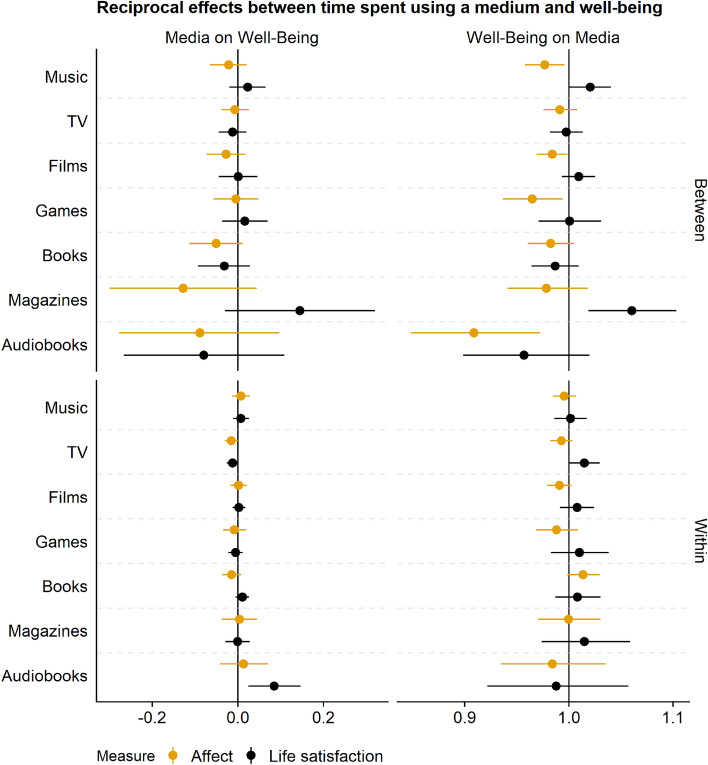
Figure 2.
This Figure shows the reciprocal effects between time spent using a medium and well-being. Points represent the mean of the posterior distribution of the effects. Lines represent 95% Credible Intervals. On the left-hand column, coefficients are of the Gaussian models; they represent an unstandardized estimate on the 0 to 10 well-being scale. On the right, coefficients are of the hurdle gamma model, meaning they represent odds of using a medium at all (hurdle part) and time spent using a medium more (gamma part). The top part shows between-person relations. The bottom part shows within-person effects. Estimates are grouped by the well-being measures, affect versus life satisfaction. Note that the range on the x-axis is different from Fig. 1 to show the CIs.

