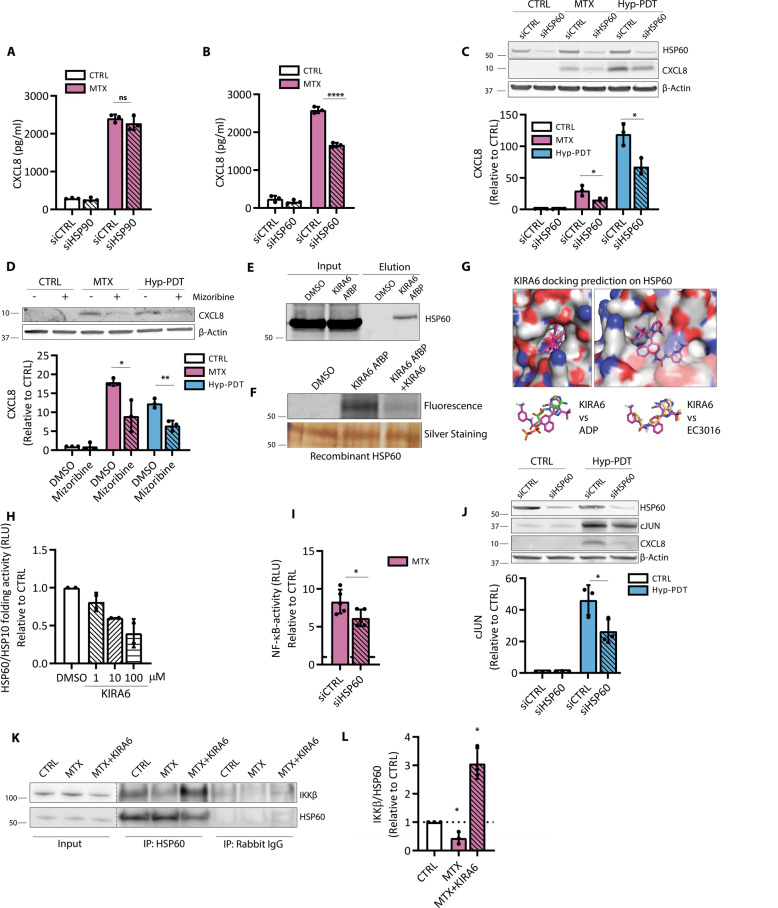
Fig. 7. HSP60 is a KIRA6 target modulating CXCL8 production.
A CXCL8 secretion measured by ELISA in conditioned medium from A375 cells upon siRNA-mediated HSP90 knockdown (siHSP90) or B HSP60 knockdown (siHSP60) compared to scramble siRNA (siCTRL) 24 h after treatment with MTX. C Effect of siHSP60 with respect to siCTRL on intracellular CXCL8 accumulation 4 h after treatment with MTX and Hyp-PDT. Data are expressed as fold change over control incubated with siCTRL. β-actin was used as loading control. D Impact of HSP60 inhibitor mizoribine (300 μM) on intracellular accumulation of CXCL8 4 h after treatment with MTX or Hyp-PDT. E Streptavidin-mediated pull-down of HSP60 with KIRA6 AfBP (10 μM) conjugated with biotin. F Recombinant HSP60 labeling with KIRA6 AfBP (10 μM) and with co-incubation KIRA6 AfBP (10 μM) and KIRA6 (100 μM). G KIRA6 docking prediction on HSP60 (PDB: 4PJ1) using Autodock Vina. This pose is compared with that obtained from docking of EC3016 (inhibitor of GroEL, prokaryotic ortholog of HSP60) and ADP into the same structure. H In vitro refolding activity of the HSP60/HSP10 chaperone complex after 1 h of incubation with heat-mediated unfolded substrate proteins in control condition or in the presence of KIRA6 at the indicated concentrations; n = 2 biological replicates/concentration. Data are expressed as fold change compared to control. I NF-κB activity measured by luciferase assay in A375 cells stably expressing the reporter 4 h after treatment of the siCTRL or siHSP60 transfected cells with MTX. Data are expressed as fold change compared to untreated cells transfected with the correspondent siRNA, whose reference value is indicated with a dotted line. J cJUN levels are measured in siHSP60 A375p with respect to siCTRL 4 h after treatment with Hyp-PDT. K, L Co-immunoprecipitation of IKKβ with HSP60 from the cytosolic fraction of A375 in basal condition or 2 h after treatment with MTX with or without co-incubation with KIRA6 (1 μM). In all graphs values are presented as mean ± SD of at least n = 3 independent biological replicates, except as reported in (H). Data are analyzed by two-tailed Student’s t-test in all the graphs except for one-sample t-test in (L) *p < 0.05, **p < 0.01,****p < 0.0001, ns not significant.

