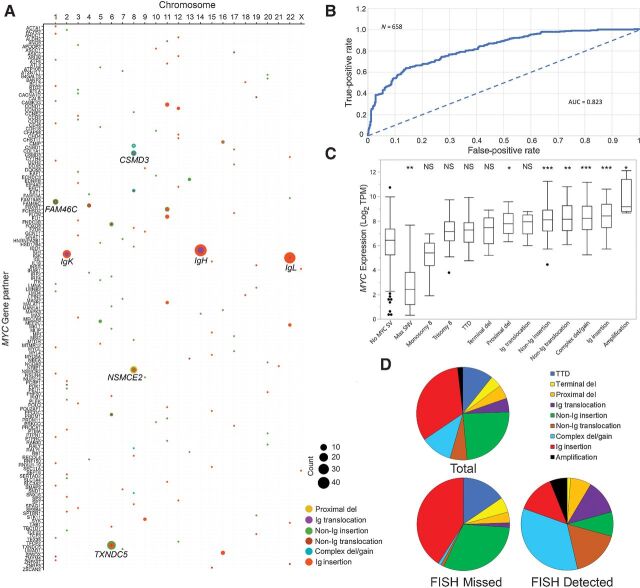
Figure 1.
MYC abnormality subtypes, partner genes, and MYC gene expression. A, Bubble plots for MYC SV partners. Gene name (x-axis) is plotted by chromosome (y-axis). No SV involving chromosome Y was detected. SV frequencies are indicated with circle size, and SV group by color (see legend). B, ROC curve for MYC Alteration Classification from MYC expression. ROC curve plotting the false-positive rate versus true-positive rate for the classification of samples for MYC alterations using mRNA expression levels in transcripts per million (TPM). Dotted lines give AUC = 0.5 for an uninformative classifier. C, Boxplot and median MYC transcript levels (log transform of Salmon TPM) of MMRF CoMMpass cases (n = 658), with observed SVs. Significant differences in each subtype were compared with the subtype with no MYC SV (***, P < 0.0001; **, P < 0.001; *, P < 0.05). D, Pie charts showing the distribution of the MYC SV in association with predicted FISH detection.

