. 2021 Jul 7;27(19):5430–5439. doi: 10.1158/1078-0432.CCR-21-0005

Figure 3.

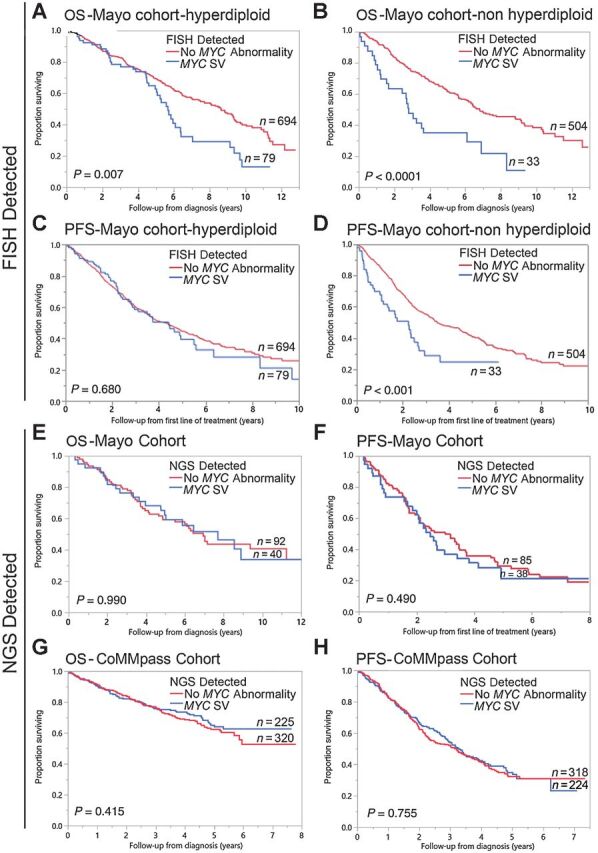
Figure 3. Impact of MYC SV detected by FISH or NGS on OS and PFS. A comparison of OS (years) in patients with a MYC SV detected by FISH (blue curve), and patients without MYC SV (red curve) among patients with hyperdiploidy in A or among patients without hyperdiploidy in B from the Mayo Cohort. OS time (median) in the hyperdiploid group was 5.7 (95% CI: 5.0–6.4) years (n = 79) and 8.6 (95% CI: 7.5–9.3) years (n = 694) in the MYC SV and no MYC SV groups, respectively. OS time (median) in the nonhyperdiploid group was 2.8 (95% CI: 1.5–6.1) years (n = 33) and 6.8 (95% CI: 6.2–8.8) years (n = 504) in the MYC SV and no MYC SV groups, respectively. A comparison of PFS (years) in patients with a MYC SV detected by FISH (blue curve), and patients without MYC SV (red curve) among patients with hyperdiploidy in C or among patients without hyperdiploidy in D from the Mayo Cohort. PFS time (median) in the hyperdiploid group was 4.4 (95% CI: 2.9–5.5) years (n = 79) and 4.3 (95% CI: 3.7–4.9) years (n = 694) in the MYC SV and no MYC SV groups, respectively. PFS time (median) in the nonhyperdiploid group was 2.6 (95% CI: 1.1–2.7) years (n = 33) and 3.5 (95% CI: 3.1–4.5) years (n = 504) in the MYC SV and no MYC SV groups, respectively. E, A comparison of OS (years) in patients with MYC SV detected by MPseq (blue curve) and patients without a MYC SV detected by MPseq (red curve) from the Mayo cohort. OS time (median) was 7.7 (95% CI: 4.8–not reached) years (n = 40) and 6.9 (95% CI: 4.8–11.2) years (n = 92) in the two groups, respectively. F, A comparison of PFS (years) in patients with MYC SV detected by MPseq (blue curve) and patients without MYC SV detected by MPseq (red curve) from the Mayo cohort. PFS time (median) was 2.5 (95% CI: 1.9–3.4) years (n = 38) and 3.0 (95% CI: 2.1–3.5) years (n = 85) in the two groups, respectively. G, A comparison of OS (years) in patients with a MYC SV detected by WGS (blue curve) and patients without a MYC SV detected by WGS (red curve) from the CoMMpass cohort. OS time (mean) was 5.7 (95% CI: 5.3–6.1) years (n = 225) and 5.5 (95% CI: 5.2–5.9) years (n = 320) in the MYC SV and no MYC SV groups, respectively. H, A comparison of PFS (years) in patients with MYC SV detected by WGS (blue curve) and patients without a MYC SV detected by WGS (red curve) from the CoMMpass cohort. PFS time (median) was 3.3 (95% CI: 2.8–3.9) years (n = 224) and 3.1 (95% CI: 2.3–3.7) years (n = 318) in the MYC SV and no MYC SV groups, respectively.

Impact of MYC SV detected by FISH or NGS on OS and PFS. A comparison of OS (years) in patients with a MYC SV detected by FISH (blue curve), and patients without MYC SV (red curve) among patients with hyperdiploidy in A or among patients without hyperdiploidy in B from the Mayo Cohort. OS time (median) in the hyperdiploid group was 5.7 (95% CI: 5.0–6.4) years (n = 79) and 8.6 (95% CI: 7.5–9.3) years (n = 694) in the MYC SV and no MYC SV groups, respectively. OS time (median) in the nonhyperdiploid group was 2.8 (95% CI: 1.5–6.1) years (n = 33) and 6.8 (95% CI: 6.2–8.8) years (n = 504) in the MYC SV and no MYC SV groups, respectively. A comparison of PFS (years) in patients with a MYC SV detected by FISH (blue curve), and patients without MYC SV (red curve) among patients with hyperdiploidy in C or among patients without hyperdiploidy in D from the Mayo Cohort. PFS time (median) in the hyperdiploid group was 4.4 (95% CI: 2.9–5.5) years (n = 79) and 4.3 (95% CI: 3.7–4.9) years (n = 694) in the MYC SV and no MYC SV groups, respectively. PFS time (median) in the nonhyperdiploid group was 2.6 (95% CI: 1.1–2.7) years (n = 33) and 3.5 (95% CI: 3.1–4.5) years (n = 504) in the MYC SV and no MYC SV groups, respectively. E, A comparison of OS (years) in patients with MYC SV detected by MPseq (blue curve) and patients without a MYC SV detected by MPseq (red curve) from the Mayo cohort. OS time (median) was 7.7 (95% CI: 4.8–not reached) years (n = 40) and 6.9 (95% CI: 4.8–11.2) years (n = 92) in the two groups, respectively. F, A comparison of PFS (years) in patients with MYC SV detected by MPseq (blue curve) and patients without MYC SV detected by MPseq (red curve) from the Mayo cohort. PFS time (median) was 2.5 (95% CI: 1.9–3.4) years (n = 38) and 3.0 (95% CI: 2.1–3.5) years (n = 85) in the two groups, respectively. G, A comparison of OS (years) in patients with a MYC SV detected by WGS (blue curve) and patients without a MYC SV detected by WGS (red curve) from the CoMMpass cohort. OS time (mean) was 5.7 (95% CI: 5.3–6.1) years (n = 225) and 5.5 (95% CI: 5.2–5.9) years (n = 320) in the MYC SV and no MYC SV groups, respectively. H, A comparison of PFS (years) in patients with MYC SV detected by WGS (blue curve) and patients without a MYC SV detected by WGS (red curve) from the CoMMpass cohort. PFS time (median) was 3.3 (95% CI: 2.8–3.9) years (n = 224) and 3.1 (95% CI: 2.3–3.7) years (n = 318) in the MYC SV and no MYC SV groups, respectively.