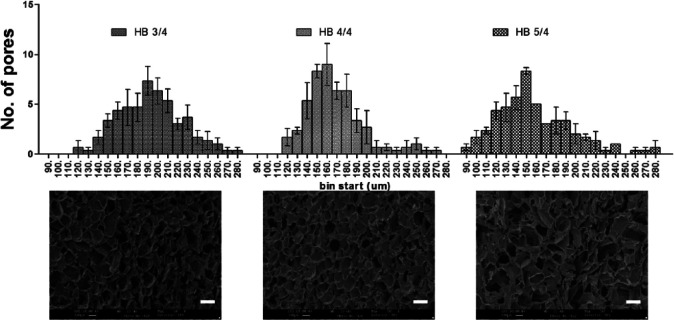
Figure 4.
Pore size distribution of MDC hydrogel with different Odex feeding concentration calculated from SEM images. The upper row shows pore size distribution graph for hydrogel formulations having 3%, 4%, and 5% Odex. The lower panel shows SEM image of respective hydrogels. Total n = 3 images were selected for each formulations and 50 random pores was selected per image for analysis. The upper row shows pore size distribution graph for hydrogel formulations having 3%, 4%, and 5% Odex. The lower panel shows SEM images of respective hydrogels. A total of 50 random pores were selected per image with n = 3 images.

