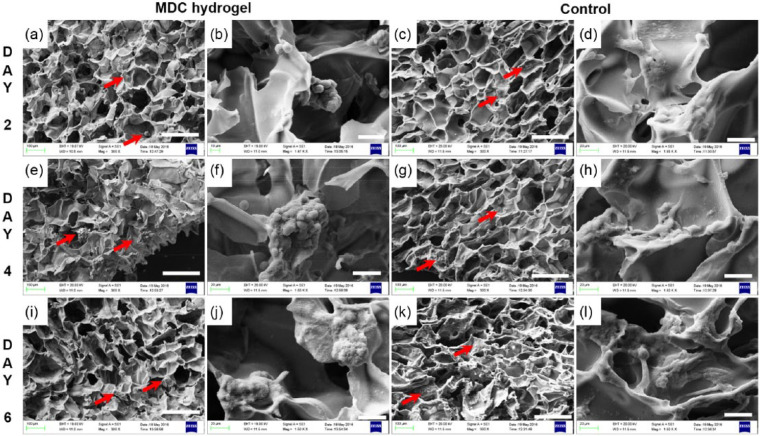
Figure 7.
SEM micrograph of cell growth and morphology on MDC versus control hydrogel. Cellular morphology at day 2 on (a, b) MDC scaffold and (c, d) control scaffold. Cellular structure at day 4 on (e, f) MDC and (g, h) control; at day 6 on (i, j) MDC and (k, l) control. Scale bar: a, c, e, g, i, k: 200 µm; b, d, f, h, j, l: 30 µm.
Red arrow indicates cells on scaffold.

