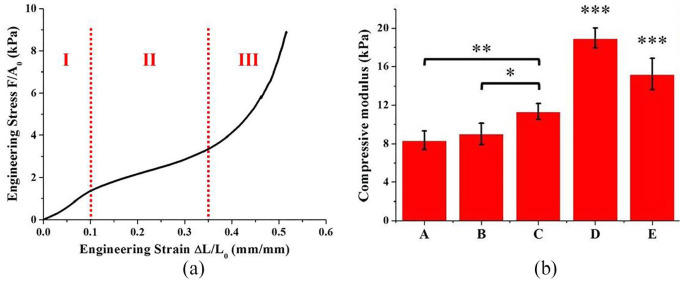
Figure 5.
(a) Example of the engineering stress versus engineering strain curve obtained for each specimen in the uniaxial unconfined compression tests in wet state. F (mN) was the applied load, A0 (mm2) the initial value of the cross-sectional area of the specimen, ΔL (mm) the displacement and L0 (mm) the initial height of the specimen. (b) Compressive moduli of the different sub-regions of the gradient scaffold and of the gradient scaffold itself (n = 6). The gradient distribution of HAp determined a gradient of stiffness in the scaffold: (A) cartilage-like region, (B) upper middle zone, (C) lower middle zone, (D) bone-like region and (E) gradient scaffold.

