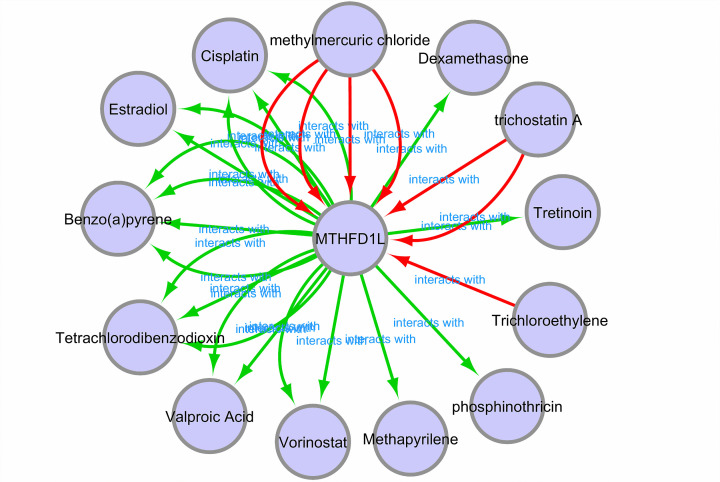
Figure 16. A gene–drug interaction network highlighting MTHFD1L-associated chemotherapeutic drugs.
Red arrows: chemotherapeutic drugs that can increase the expression of MTHFD1L; green arrows: chemotherapeutic drugs that can suppress the expression of MTHFD1L. A count of arrows between drug and gene in the network represent the supported numbers of studies by the literature.

