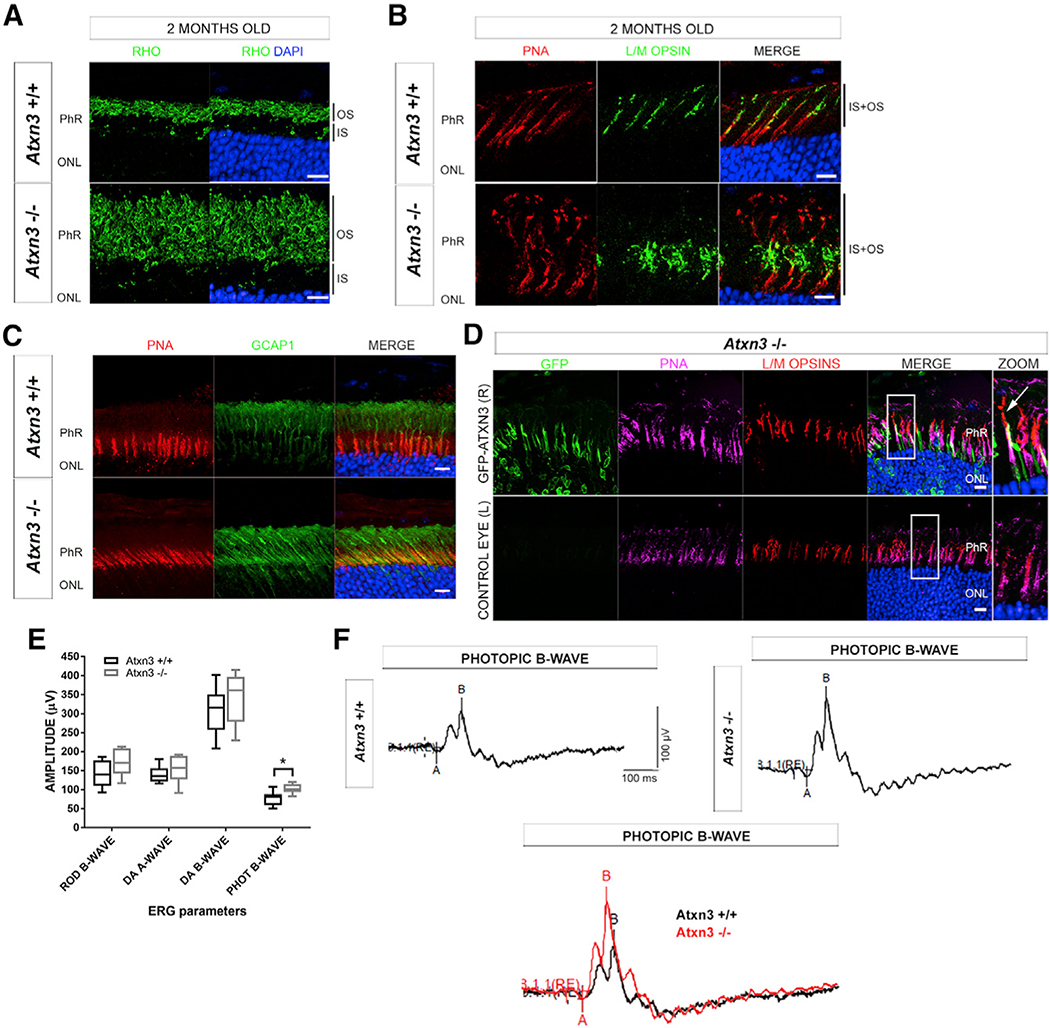
Figure 2. Mouse Atxn3 KO Retinas Show Elongation of PhR OSs, Cone Opsin Mislocalization, and Hyperactivation of Cone Response.
(A) Rod OSs (black bars at the right side) in Atxn3 KO (Atxn3−/−) retinas are much longer than those of WT (Atxn3+/+). RHO, rhodopsin (green).
(B) Cone OSs (labeled with PNA, red) in Atxn3 KO retinas are longer and show mislocalization of opsins (L/M opsins, green), which also extend into the inner segment (IS) of cones (black bars at the right side).
(C) GCAP1 (green) is also mislocalized in the IS and ONL of Atxn3 KO cones (PNA, red) compared to WT retinas. Antigen retrieval protocols used to detect GCAP1 partially interfered with PNA staining. Scale bar, 10 μm.
(D) After subretinal microinjection of GFP-ATXN3 WT expression construct in the right eye (R) of Atxn3 KO pups, the mislocalization of L/M cone opsins (red) is partially rescued in transfected cones (green), as L/M opsins localize along the whole length of the cone OS (PNA, magenta). In zoom images, the white arrow indicates a transfected cone where opsins correctly distribute along the OS. The left eye of each animal was not transfected and used as a control eye (L). Nuclei were counterstained with DAPI (blue); scale bar, 10 μm (n = 3 per group). Accompanying 3D reconstructions are in Videos S1 and S2. (A–D) Names of all retinal layers are abbreviated as in Figure 1A.
(E) ERG recordings of WT (black) and Atxn3 KO animals (gray): rod B-wave (scotopic light), photopic (PHOT) B-wave (cones and cone bipolar cells), and combined response to light in dark adapted retinas (DA) A-wave (combined rods and cones) and DA B-wave (bipolar cell response) show that the cone (photopic response) is hyperactivated in the absence of ATXN3 (Mann-Whitney test, *p < 0.05, two eyes of 3–4 animals per group).
(F) Representative ERG recordings of the photopic B-wave in WT and KO retinas and their overlap (bottom) for direct visualization of cone hyperactivation in KO retinas.

