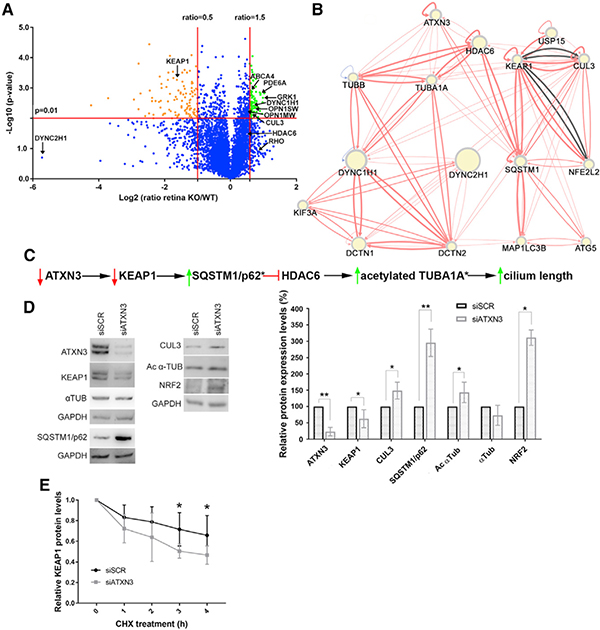
Figure 4. Neural Retina Proteomics in Atxn3 KO Mice and Knockdown Assays in Cultured Cells Show That KEAP1 Levels Are Decreased when ATXN3 Expression Is Depleted.
(A) Proteomics volcano plot of neural retinas from 2-year-old Atxn3 KO versus WT mice, plotting the −log10 (p value) against the log2 ratio (fold change). Thresholds were set at a significance of p < 0.01 and a ratio of 50% change (0.5 and 1.5). Over-represented and under-represented proteins in Atxn3 KO retinas are highlighted in green and orange. Some relevant retinal proteins are also indicated. Gene Ontology (GO) classification is in Table S3.
(B) Network generated by RPGenet v2.0 links ATXN3 by KEAP1-SQSTM1 to the HDAC6-acetylated α-tubulin signaling pathway, which controls ciliary length. The direction and strength of the interaction between the connected nodes is respectively indicated by the arrows and width of the connecting edges (red lines, physical interaction; gray lines, genetic interaction). Node size differences are not relevant for this work.
(C) Proposed pathways whereby ATXN3 depletion cause a decrease of KEAP1, which leads to an increase of SQSTM1 (p62), a negative regulator of the HDAC6 deacetylase activity. Inhibition of HDAC6 increases the pool of acetylated α-tubulin, which can then polymerize and increase ciliary length. An asterisk (*) indicates the proteins whose peptides were not identified in the proteomics analyses.
(D) Knockdown of endogenous ATXN3 causes a sharp decrease of KEAP1 levels in ARPE-19 cells, with a concomitant increase of SQSTM1 and acetylated α-tubulin (as well as other proteins of the KEAP1/NR2F2 pathway). Statistical significance was determined by one-sample t test or Wilcoxon rank-sum test (*p < 0.05, **p < 0.01).
(E) The half-life of KEAP1 is clearly decreased after ATXN3 knockdown in HEK293T cells under cycloheximide protein-synthesis inhibition (CHX). Mann-Whitney test, n = 4–6 (*p < 0.05, **p < 0.01).

