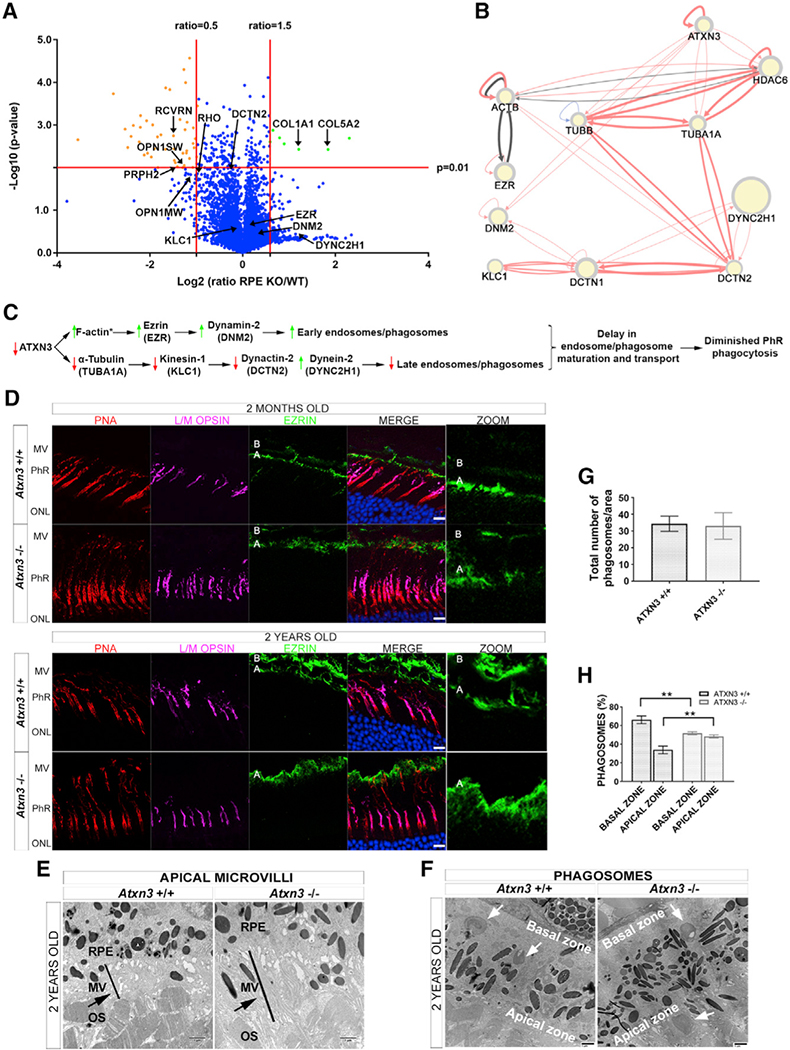
Figure 5. ATXN3 Regulates PhR Phagocytosis by Modulating Endosome Maturation and Transport in the RPE.
(A) Proteomics volcano plot of RPEs from Atxn3 KO versus WT mice, the plotting −log10 (p value) against the log2 ratio (fold change). Thresholds and protein highlights are as in Figure 4A.
(B) Network generated by RPGenet v2.0 that links ATXN3 to cytoskeleton and microtubule motor proteins that control phagosome maturation and vesicle transport in RPE cells. Node size is not relevant for this work.
(C) Proposed pathways whereby the depletion of ATXN3 alters phagosome formation and maturation within the RPE cells. An asterisk (*) indicates the proteins whose peptides were not identified in the proteomics analyses.
(D) Ezrin expression (green) is increased in 2-month- and 2-year-old Atxn3 KO RPE compared with controls. The increase of ezrin is visible in the apical zone of the RPE (A), where the microvilli are located, but not in the basal zone (B), see zoom panel at the right. Cones are detected by L/M opsins (magenta) and PNA (red); nuclei are labeled with DAPI (blue). See 3D visualization in Videos S3 and S4. Scale bar, 10 μm. MV, apical microvilli.
(E) Increased ezrin expression is confirmed by an increase in microvilli surface and length (black bar) in the interphotoreceptor matrix of Atxn3 KO retinas in TEM images. The black arrow points to longer MV in Atxn3−/− retinas.
(F–H) The RPE of Atxn3 KO mice displayed delayed phagosome maturation as visualized in (F), a representative TEM image showing more phagosomes in the apical than in the basal zone (white arrows). (G) No apparent difference in the total number of phagosomes per counting area was detected between WT and Atxn3 KO RPEs, but as shown in (H), more phagosomes accumulated in the apical versus the basal zone in Atxn3 KO RPE (51.7% versus 48.3%) compared to WT RPE (33.9% versus 72.1%) (n > 10 images, 3 animals per genotype). Two-way ANOVA test (**p < 0.01).

