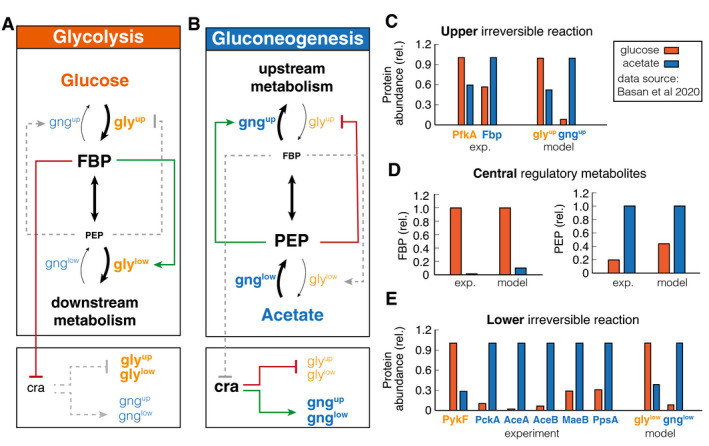
Figure 1. Self‐organization of metabolism in glycolysis and gluconeogenesis.

-
A, BGraphic summary of the reorganization in glycolysis and gluconeogenesis. Linewidth of reaction arrows indicates magnitude of flux. Font size of metabolites and enzymes indicates metabolite concentrations and enzyme abundances, respectively. Active regulation is indicated by red/green color, and inactive regulation is gray and dashed.
-
C–ECalibration of model to experimental data (from Basan et al, 2020) metabolite concentrations and enzyme abundances relative to the highest concentration or abundance. Note the striking, differential regulation of FBP and PEP, high in one condition and low in the other.
