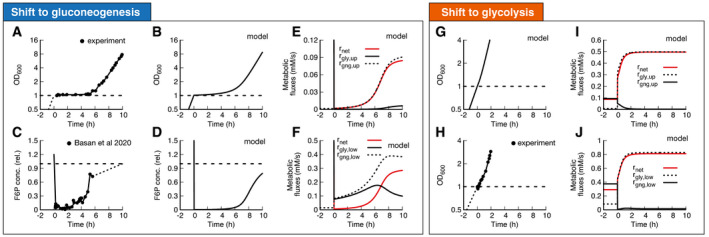
Figure 2. Shifts between glycolysis and gluconeogenesis.

-
A, B(A) Experimental and (B) model of optical density after shift of E. coli from glucose to acetate. Growth shows a substantial lag before it recovers.
-
C, D(C) Experimental and (D) model of F6P (normalized to the final state) collapses after shit to acetate and continues to stay low throughout lag phase. Because F6P is an essential precursor for biomass production, this limitation effectively stops biomass growth. Data points show a single time‐series from (Basan et al, 2020).
-
E, FFluxes of all irreversible reactions in units of intracellular concentration per time. Especially fluxes in lower glycolysis/gluconeogenesis are of equal magnitude, leading to a futile cycle, where no net flux (red line) through central carbon metabolism can be established.
-
G–JOptical density and metabolic fluxes for the reversed shift from acetate to glucose show immediate growth and no intermittent futile cycling. The dynamics of all enzyme abundances, regulation, and fluxes for both shifts are shown in Appendix Figs S1–S5 in detail. The model also correctly predicts that enzyme abundances only adapt late in the lag phase (Appendix Fig S6).
