Fig. 2.
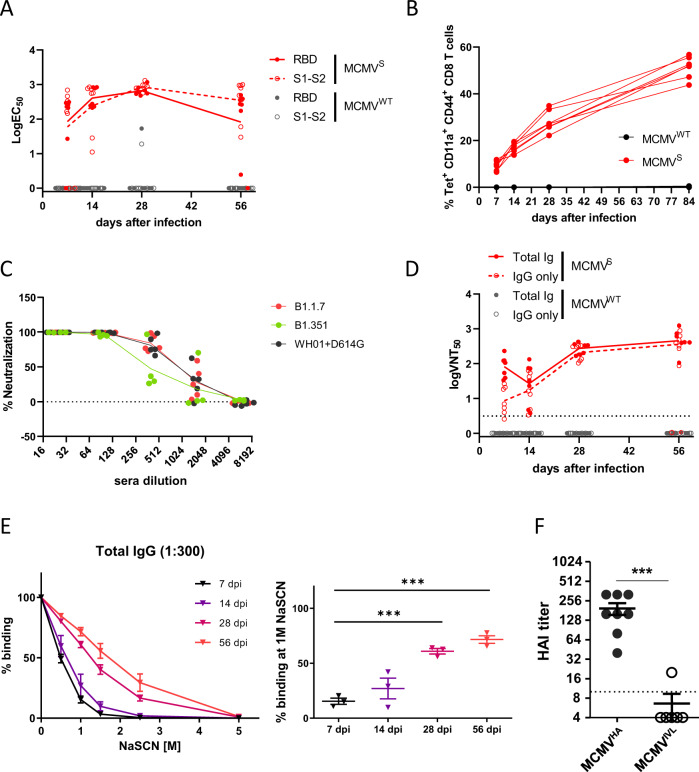
Immunization with MCMVS and MCMVHA elicits antigen-specific and neutralizing humoral responses. BALB/c (A, C–E) or C57BL/6 (B) mice were infected i.p. with 2 × 10⁵ PFU or 1 × 10⁶ PFU, respectively, of MCMVS or MCMVWT. Collected sera were tested for antigen-specific responses and neutralization capacity. A EC50 values of IgG isotypes specific for S1-S2 or the RBD. Each symbol indicates an individual mouse, and the geometric means of individual time points are connected with lines. B Blood CD8+ T cells were analyzed by tetramer staining for the frequency of antigen-specific CD8+ T cells in the primed (CD11a+CD44+) subset. Each line indicates CD8+ T-cell responses from one mouse over time. C Pseudovirus neutralization capacity (pVNT50) against the SARS-CoV-2 S WH01 + D614G, B.1.1.7 and B.1.351 variants. The assay was performed in technical triplicates, and the mean values for each mouse serum sample are shown, where each symbol represents the percentage of neutralization of a mouse serum sample at 56 dpi. The values were calculated as luciferase units. Lines connect the group averages for each serum dilution step. D Neutralization capacity (VNT50) against SARS-CoV-2 of total serum immunoglobulins (total Igs) or their IgG fraction (IgG only) at the indicated time points post immunization. Each symbol indicates the serum from one mouse, and lines connect the geometric means for each time point. E Percentage of serum antibodies binding to the S protein (y axis) in the presence of increasing concentrations of NaSCN (left) or 1 M NaSCN (right) and normalized to the ELISA values in the absence of NaSCN. Each line connects the average residual binding at the indicated molar concentrations of NaSCN. The error bars are standard deviations (SDs). The assay was performed in biological triplicates, and data from the indicated time points post-immunization were statistically compared by one-way ANOVA. *** p < 0.001 (F) BALB/c mice were i.p. infected with 2 × 10⁵ PFU of indicated virus. The titers of HA-specific antibodies at 28 dpi with MCMVHA or MCMVIVL were tested. The data were pooled from two independent experiments. The long horizontal lines indicate the means. The Mann–Whitney U test was used for statistical analysis. *** p < 0.001

